---
title: "Coronavirus : spatially smoothed decease in France"
description: ""
author: "Michaël"
date: "2020-03-30"
date-modified: last-modified
categories:
- R
- french
- raster
- spatial
draft: false
freeze: true
editor_options:
chunk_output_type: console
chunk_output_type: console
---
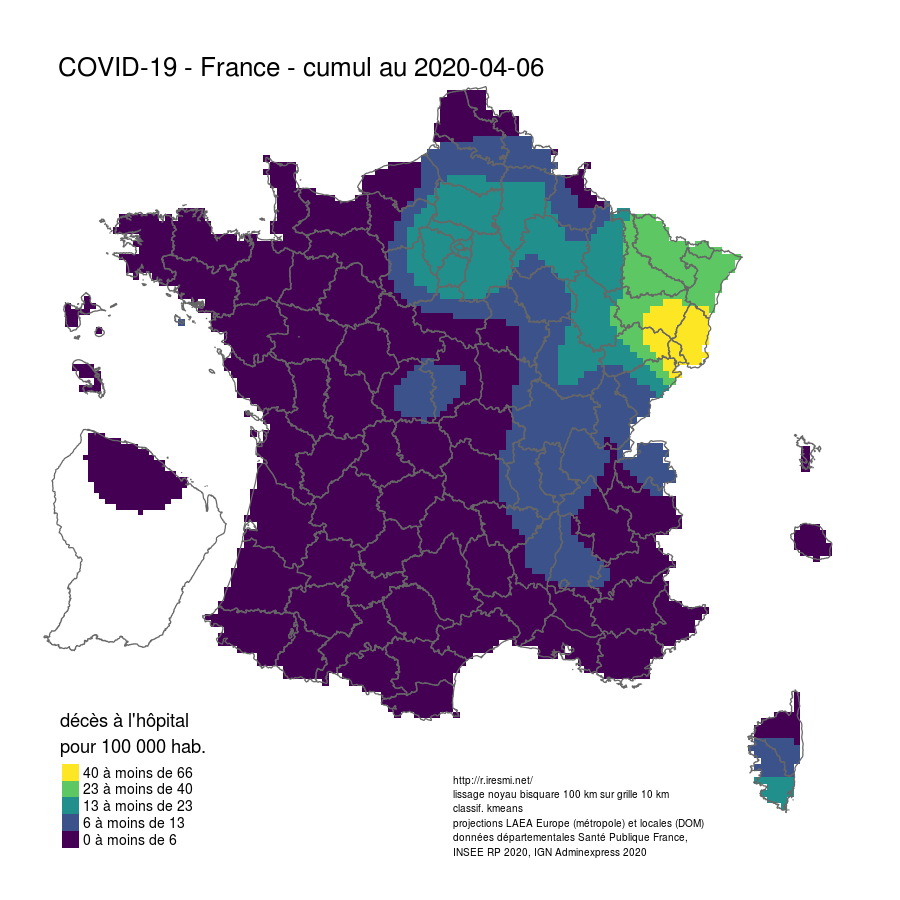{fig-alt="A map of smoothed death prevalence of COVID-19 in France, highlighting the strong prevalence in the NW"}
See also the [animated map](/posts/2020/covid_19_decease_animation_map/).
From the official data by [Santé Publique France](https://www.data.gouv.fr/fr/datasets/donnees-hospitalieres-relatives-a-lepidemie-de-covid-19/), we spatially smooth the decease (produced by SPF at the *département* scale) and normalize by a similarly smoothed population grid. For that we use the [{btb}](https://cran.r-project.org/package=btb) package.
```{r}
#| results: hide
# Carto décès COVID 19 France
# avec lissage

map_date <- "2020-04-06"


# config ------------------------------------------------------------------

library(tidyverse)
library(httr)
library(fs)
library(sf)
library(readxl)
library(janitor)
library(glue)
library(tmap)
library(grid)
library(classInt)
# + btb, raster, fasterize, plyr


# sources -----------------------------------------------------------------

# https://www.data.gouv.fr/fr/datasets/donnees-hospitalieres-relatives-a-lepidemie-de-covid-19/
fichier_covid <- "donnees/covid.csv"
url_donnees_covid <- "https://www.data.gouv.fr/fr/datasets/r/63352e38-d353-4b54-bfd1-f1b3ee1cabd7"

# https://www.insee.fr/fr/statistiques/2012713#tableau-TCRD_004_tab1_departements
fichier_pop <- "donnees/pop.xlsx"
url_donnees_pop <- "https://www.insee.fr/fr/statistiques/fichier/2012713/TCRD_004.xlsx"

# Adminexpress : à télécharger manuellement
# https://geoservices.ign.fr/documentation/diffusion/telechargement-donnees-libres.html#admin-express
aex <- path_expand("~/data/adminexpress/adminexpress_cog_simpl_000_2022.gpkg")

rayon <- 1e5 # distance de lissage (m)
pixel <- 10000 # résolution grille (m)

force_download <- TRUE # retélécharger même si le fichier existe et a été téléchargé aujourd'hui ?

#' Kernel weighted smoothing with arbitrary bounding area
#'
#' @param df sf object (points)
#' @param field weight field in the df
#' @param bandwidth kernel bandwidth (map units)
#' @param resolution output grid resolution (map units)
#' @param zone sf study zone (polygon)
#' @param out_crs EPSG (should be an equal-area projection)
#'
#' @return a raster object
#' @import btb, raster, fasterize, dplyr, plyr, sf
lissage <- function(df, field, bandwidth, resolution, zone, out_crs = 3035) {
  if (st_crs(zone)$epsg != st_crs(out_crs)$epsg) {
    message("reprojecting data...")
    zone <- st_transform(zone, out_crs)
  }

  if (st_crs(df)$epsg != st_crs(out_crs)$epsg) {
    message("reprojecting study zone...")
    df <- st_transform(df, out_crs)
  }

  zone_bbox <- st_bbox(zone)

  # grid generation
  message("generating reference grid...")
  zone_xy <- zone %>%
    dplyr::select(all_of(attr(zone, "sf_column"))) %>%
    st_make_grid(
      cellsize = resolution,
      offset = c(
        plyr::round_any(zone_bbox[1] - bandwidth, resolution, f = floor),
        plyr::round_any(zone_bbox[2] - bandwidth, resolution, f = floor)
      ),
      what = "centers"
    ) %>%
    st_sf() %>%
    st_join(zone, join = st_intersects, left = FALSE) %>%
    st_coordinates() %>%
    as_tibble() %>%
    dplyr::select(x = X, y = Y)

  # kernel
  message("computing kernel...")
  kernel <- df %>%
    cbind(., st_coordinates(.)) %>%
    st_set_geometry(NULL) %>%
    dplyr::select(x = X, y = Y, field) %>%
    btb::btb_smooth(
      sEPSG = out_crs,
      iCellSize = resolution,
      iBandwidth = bandwidth,
      vQuantiles = NULL,
      dfCentroids = zone_xy
    )

  # rasterization
  message("\nrasterizing...")
  raster::raster(
    xmn = plyr::round_any(zone_bbox[1] - bandwidth, resolution, f = floor),
    ymn = plyr::round_any(zone_bbox[2] - bandwidth, resolution, f = floor),
    xmx = plyr::round_any(zone_bbox[3] + bandwidth, resolution, f = ceiling),
    ymx = plyr::round_any(zone_bbox[4] + bandwidth, resolution, f = ceiling),
    resolution = resolution,
    crs = st_crs(out_crs)$epsg
  ) %>%
    fasterize::fasterize(kernel, ., field = field)
}


# téléchargement--------------------------------------------------------------

dir_create("donnees")
dir_create("results")

if (!file_exists(fichier_covid) |
    file_info(fichier_covid)$modification_time < Sys.Date() |
    force_download) {
  GET(url_donnees_covid,
      progress(),
      write_disk(fichier_covid, overwrite = TRUE))
}
if (!file_exists(fichier_pop)) {
  GET(url_donnees_pop,
      progress(),
      write_disk(fichier_pop))
}


# données -----------------------------------------------------------------

covid <- covid <- read_csv2(fichier_covid) %>%
  filter(jour <= map_date)

# adminexpress prétéléchargé
dep <- read_sf(aex, "departement") %>%
  filter(insee_dep < "971")|>
  st_transform("EPSG:2154")

dep_971 <- read_sf(aex, "departement") %>%
  filter(insee_dep == "971") |>
  st_transform("EPSG:5490")

dep_972 <- read_sf(aex, "departement") %>%
  filter(insee_dep == "972") |>
  st_transform("EPSG:5490")

dep_973 <- read_sf(aex, "departement") %>%
  filter(insee_dep == "973") |>
  st_transform("EPSG:2972")

dep_974 <- read_sf(aex, "departement") %>%
  filter(insee_dep == "974") |>
  st_transform("EPSG:2975")

dep_976 <-read_sf(aex, "departement") %>%
  filter(insee_dep == "976") |>
  st_transform("EPSG:4471")

pop <- read_xlsx(fichier_pop, skip = 2) %>%
  clean_names() %>%
  select(insee_dep = x1,
         x2020)


# prétraitement -----------------------------------------------------------

# contour métropole
fr <- dep %>%
  st_union() %>%
  st_sf()

# jointures des données
creer_df <- function(territoire) {
  territoire %>%
    left_join(pop, join_by(insee_dep)) %>%
    left_join(
      covid %>%
        filter(jour == max(jour),
               sexe == 0) %>%
        group_by(dep) %>%
        summarise(deces = sum(dc, na.rm = TRUE),
                  reanim = sum(rea, na.rm = TRUE),
                  hospit = sum(hosp, na.rm = TRUE)),
      join_by(insee_dep == dep)) %>%
    st_point_on_surface()
}

covid_geo_pop     <- creer_df(dep)
covid_geo_pop_971 <- creer_df(dep_971)
covid_geo_pop_972 <- creer_df(dep_972)
covid_geo_pop_973 <- creer_df(dep_973)
covid_geo_pop_974 <- creer_df(dep_974)
covid_geo_pop_976 <- creer_df(dep_976)


# lissage -----------------------------------------------------------------
# génération des grilles mortalité, hospitalisation et réanimation et population
# et création des grilles pour 1e5 habitants

# décès métropole et DOM
d <- covid_geo_pop %>%
  lissage("deces", rayon, pixel, fr)

d_971 <- covid_geo_pop_971 %>%
  lissage("deces", rayon, pixel, dep_971, "EPSG:5490")

d_972 <- covid_geo_pop_972 %>%
  lissage("deces", rayon, pixel, dep_972, "EPSG:5490")

d_973 <- covid_geo_pop_973 %>%
  lissage("deces", rayon, pixel, dep_973, "EPSG:2972")

d_974 <- covid_geo_pop_974 %>%
  lissage("deces", rayon, pixel, dep_974, "EPSG:2975")

d_976 <- covid_geo_pop_976 %>%
  lissage("deces", rayon, pixel, dep_976, "EPSG:4471")

# population métropole et DOM
p <- covid_geo_pop %>%
  lissage("x2020", rayon, pixel, fr)

p_971 <- covid_geo_pop_971 %>%
  lissage("x2020", rayon, pixel, dep_971, "EPSG:5490")

p_972 <- covid_geo_pop_972 %>%
  lissage("x2020", rayon, pixel, dep_972, "EPSG:5490")

p_973 <- covid_geo_pop_973 %>%
  lissage("x2020", rayon, pixel, dep_973, "EPSG:2972")

p_974 <- covid_geo_pop_974 %>%
  lissage("x2020", rayon, pixel, dep_974, "EPSG:2975")

p_976 <- covid_geo_pop_976 %>%
  lissage("x2020", rayon, pixel, dep_976, "EPSG:4471")

# grilles pour 1e5 hab
d100k <- d * 1e5 / p
d100k_971 <- d_971 * 1e5 / p_971
d100k_972 <- d_972 * 1e5 / p_972
d100k_973 <- d_973 * 1e5 / p_973
d100k_974 <- d_974 * 1e5 / p_974
d100k_976 <- d_976 * 1e5 / p_976

# réanimation et hospitalisation métropole uniquement
r <- covid_geo_pop %>%
  lissage("reanim", rayon, pixel, fr)
r100k <- r * 1e5 / p

h <- covid_geo_pop %>%
  lissage("hospit", rayon, pixel, fr)
h100k <- h * 1e5 / p


# carto -------------------------------------------------------------------

# décès métropole et DOM

# classification à réutiliser pour les 6 cartes
set.seed(1234)
classes <- classIntervals(raster::values(d100k), n = 5, style = "kmeans", dataPrecision = 0)$brks

# métro et DOM
carte_d <- tm_layout(title = paste("COVID-19 - France - cumul au", max(covid$jour)),
                     legend.position = c("left", "bottom"),
                     frame = FALSE) +
  tm_shape(d100k) +
  tm_raster(title = glue("décès à l'hôpital
                         pour 100 000 hab."),
            style = "fixed",
            breaks = classes,
            palette = "viridis",
            legend.format = list(text.separator = "à moins de",
                                 digits = 0),
            legend.reverse = TRUE) +
  tm_shape(dep) +
  tm_borders() +
  tm_credits(glue("http://r.iresmi.net/
                  lissage noyau bisquare {rayon / 1000} km sur grille {pixel / 1000} km
                  classif. kmeans
                  projections LAEA Europe (métropole) et locales (DOM)
                  données départementales Santé publique France,
                  INSEE RP 2020, IGN Adminexpress 2020"),
             size = .5,
             position = c(.5, .025))


tm_971 <- tm_shape(d100k_971, ext = 0.7) +
  tm_raster(style = "fixed",
            breaks = classes,
            palette = "viridis",
            legend.show = FALSE) +
  tm_shape(dep_971) +
  tm_borders() +
  tm_layout(frame = FALSE,
            bg.color = NA)

tm_972 <- tm_shape(d100k_972, ext = 0.7) +
  tm_raster(style = "fixed",
            breaks = classes,
            palette = "viridis",
            legend.show = FALSE) +
  tm_shape(dep_972) +
  tm_borders() +
  tm_layout(frame = FALSE,
            bg.color = NA)

tm_973 <- tm_shape(d100k_973) +
  tm_raster(style = "fixed",
            breaks = classes,
            palette = "viridis",
            legend.show = FALSE) +
  tm_shape(dep_973) +
  tm_borders() +
  tm_layout(frame = FALSE,
            bg.color = NA)

tm_974 <- tm_shape(d100k_974, ext = 0.75) +
  tm_raster(style = "fixed",
            breaks = classes,
            palette = "viridis",
            legend.show = FALSE) +
  tm_shape(dep_974) +
  tm_borders()+
  tm_layout(frame = FALSE,
            bg.color = NA)

tm_976 <- tm_shape(d100k_976, ext = 0.6) +
  tm_raster(style = "fixed",
            breaks = classes,
            palette = "viridis",
            legend.show = FALSE) +
  tm_shape(dep_976) +
  tm_borders()+
  tm_layout(frame = FALSE,
            bg.color = NA)

# assemblage
fichier_carto <- glue("results/covid_fr_{max(covid$jour)}.png")

tmap_save(carte_d, fichier_carto, width = 900, height = 900, scale = .4,
          insets_tm = list(tm_971, tm_972, tm_973, tm_974, tm_976),
          insets_vp = list(viewport(x = .1, y = .65, width = .15, height = .15),
                           viewport(x = .1, y = .58, width = .15, height = .15),
                           viewport(x = .15, y = .4, width = .35, height = .45),
                           viewport(x = .9, y = .4, width = .15, height = .15),
                           viewport(x = .9, y = .5, width = .15, height = .15)))
```
