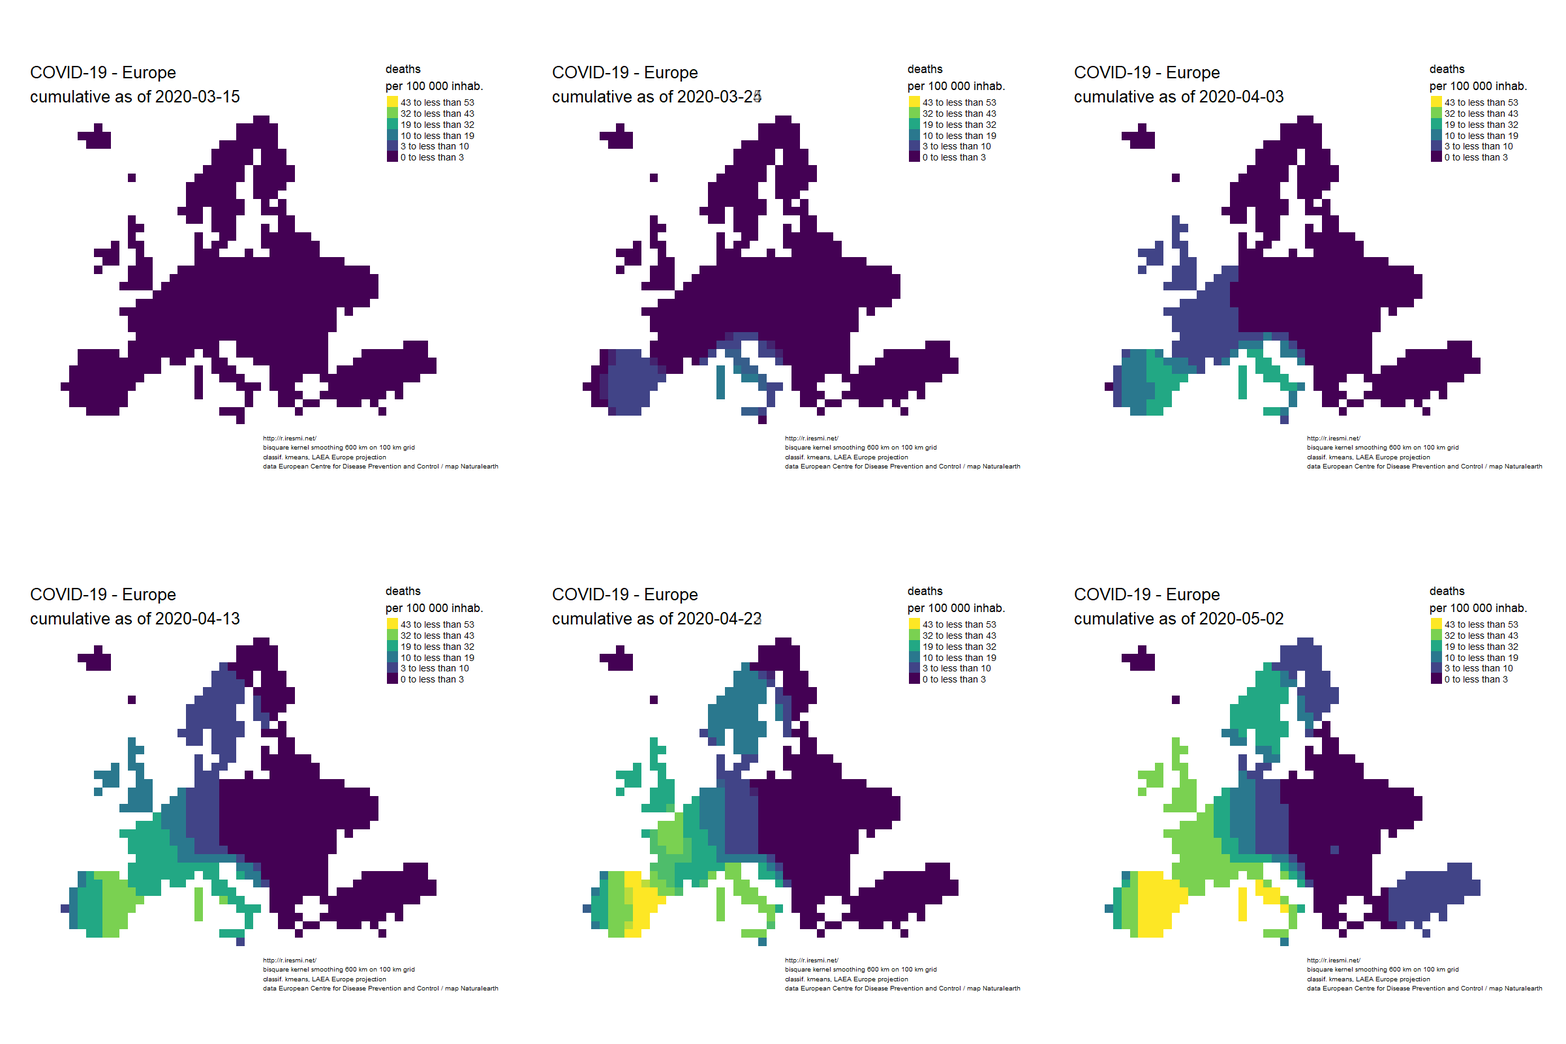
# Europe COVID-19 deaths animated map
# http://r.iresmi.net/
# data European Centre for Disease Prevention and Control


# packages ----------------------------------------------------------------
library(tidyverse)
library(httr)
library(fs)
library(sf)
library(readxl)
library(janitor)
library(glue)
library(tmap)
library(grid)
library(classInt)
library(magick)
# + btb, raster, fasterize, plyr


# sources -----------------------------------------------------------------

# https://data.europa.eu/euodp/en/data/dataset/covid-19-coronavirus-data
covid_file <- "covid_eu.csv"
covid_url <- "https://opendata.ecdc.europa.eu/covid19/casedistribution/csv"

countries_file <- "~/data/naturalearth/ne_50m_admin_0_countries.shp"
countries_url <- "https://www.naturalearthdata.com/http//www.naturalearthdata.com/download/50m/cultural/ne_50m_admin_0_countries.zip"


# config ------------------------------------------------------------------

radius <- 600000 # smoothing radius (m)
pixel <- 100000 # grid resolution (m)

force_download <- FALSE # download even if already downloaded today ?

#' Kernel weighted smoothing with arbitrary bounding area
#'
#' @param df sf object (points)
#' @param field weight field in the df
#' @param bandwidth kernel bandwidth (map units)
#' @param resolution output grid resolution (map units)
#' @param zone sf study zone (polygon)
#' @param out_crs EPSG (should be an equal-area projection)
#'
#' @return a raster object
#' @import btb, raster, fasterize, dplyr, plyr, sf
lissage <- function(df, field, bandwidth, resolution, zone, out_crs = 3035) {
  if (st_crs(zone)$epsg != out_crs) {
    message("reprojecting data...")
    zone <- st_transform(zone, out_crs)
  }

  if (st_crs(df)$epsg != out_crs) {
    message("reprojecting study zone...")
    df <- st_transform(df, out_crs)
  }

  zone_bbox <- st_bbox(zone)

  # grid generation
  message("generating reference grid...")
  zone_xy <- zone |>
    dplyr::select(geometry) |>
    st_make_grid(
      cellsize = resolution,
      offset = c(plyr::round_any(zone_bbox[1] - bandwidth, resolution, f = floor),
                 plyr::round_any(zone_bbox[2] - bandwidth, resolution, f = floor)),
      what = "centers") |>
    st_sf() |>
    st_join(zone, join = st_intersects, left = FALSE) |>
    st_coordinates() |>
    as_tibble() |>
    dplyr::select(x = X, y = Y)

  # kernel
  message("computing kernel...")
  kernel <- cbind(df, st_coordinates(x = df)) |>
    st_set_geometry(NULL) |>
    dplyr::select(x = X, y = Y, field) |>
    btb::kernelSmoothing(
      dfObservations = _,
      sEPSG = out_crs,
      iCellSize = resolution,
      iBandwidth = bandwidth,
      vQuantiles = NULL,
      dfCentroids = zone_xy
    )

  # rasterization
  message("\nrasterizing...")
  raster::raster(
    xmn = plyr::round_any(zone_bbox[1] - bandwidth, resolution, f = floor),
    ymn = plyr::round_any(zone_bbox[2] - bandwidth, resolution, f = floor),
    xmx = plyr::round_any(zone_bbox[3] + bandwidth, resolution, f = ceiling),
    ymx = plyr::round_any(zone_bbox[4] + bandwidth, resolution, f = ceiling),
    resolution = resolution
  ) |>
    fasterize::fasterize(kernel, raster = _, field = field)
}


# download data ------------------------------------------------------------

dir_create("data")
dir_create("results")
dir_create("results/animation_eu")

if (!file_exists(path("data", covid_file)) |
    file_info(path("data", covid_file))$modification_time < Sys.Date() |
    force_download) {
  GET(covid_url,
      progress(),
      write_disk(path("data", covid_file), overwrite = TRUE)) |>
    stop_for_status()
}

if (!file_exists(countries_file)) {
  dl <- file_temp()

  GET(countries_url,
      progress(),
      write_disk(dl)) |>
    stop_for_status()

  unzip(dl, exdir = dirname(countries_file))
}


# data --------------------------------------------------------------------

# some countries doesn't have data for the first or latest days ; we fill with latest
# data
covid <- read_csv(path("data", covid_file),
                  col_types = cols(dateRep = col_date(format = "%d/%m/%Y")),
                  na = c("N/A", "")) |>
  clean_names() |>
  filter(date_rep < "2020-05-02") |>
  complete(geo_id, date_rep) |>
  replace_na(list(deaths = 0)) |>
  group_by(geo_id) |>
  arrange(date_rep) |>
  mutate(deaths_cum = cumsum(deaths)) |>
  fill(countryterritory_code, countries_and_territories, pop_data2019, continent_exp, .direction = "up") |>
  ungroup() |>
  select(-c(day, month, year, cases))

# keep only european countries minus Russia and adding TUR and CYP
# remove overseas territories, reproject in LAEA
countries <- read_sf(countries_file) |>
  clean_names() |>
  filter(continent == "Europe" & iso_a3_eh != "RUS" | iso_a3_eh %in% c("TUR", "CYP")) |>
  st_cast("POLYGON") |>
  st_join(c(xmin = -20, xmax = 35, ymin = 35, ymax = 70) |>
            st_bbox() |>
            st_as_sfc() |>
            st_as_sf() |>
            st_set_crs("EPSG:4326"),
          left = FALSE) |>
  group_by(iso_a3_eh) |>
  summarise(geometry = st_combine(geometry)) |>
  st_transform("EPSG:3035")

# pretreatment -----------------------------------------------------------


# mask to generate grid : union all countries
unioned_countries_file <- "data/eu.rds"

if (!file_exists(unioned_countries_file)) {
  unioned_countries <- countries |>
    st_union() |>
    st_sf() |>
    rename("geometry" = 1) |>
    write_rds(unioned_countries_file)
} else {
  unioned_countries <- read_rds(unioned_countries_file)
}

# join countries/data for a specific date
create_df <- function(territory, date = NULL) {
  covid |>
    filter(date_rep == ifelse(is.null(date), max(date_rep), date)) |>
    right_join(countries,
              by = c("countryterritory_code" = "iso_a3_eh")) |>
    st_as_sf() |>
    st_point_on_surface() |>
    drop_na(deaths_cum) |>
    st_as_sf()
}

covid_geo <- create_df(countries)


# smoothing for last date ---------------------------------------------------

# deaths
d <- covid_geo |>
  lissage("deaths_cum", radius, pixel, unioned_countries)

# population
p <- covid_geo |>
  lissage("pop_data2019", radius, pixel, unioned_countries)

# grid per 100000 inhab
death_pop <- d * 1e5 / p


# carto -------------------------------------------------------------------

# classification for last date to be reused in animation
set.seed(1234)
classes <- classIntervals(raster::values(death_pop), n = 6, style = "kmeans", dataPrecision = 0)$brks


# animation ---------------------------------------------------------------

image_animation <- function(date) {
  message(glue("\n\n{date}\n==========\n"))

  m <- create_df(countries, date) |>
    lissage("deaths_cum", radius, pixel, unioned_countries) |>
    magrittr::divide_by(p) |>
    magrittr::multiply_by(100000) |>
    tm_shape() +
    tm_raster(title = glue("deaths
                         per 100 000 inhab."),
              style = "fixed",
              breaks = classes,
              palette = "viridis",
              legend.format = list(text.separator = "to less than",
                                   digits = 0),
              legend.reverse = TRUE) +
    tm_layout(title = glue("COVID-19 - Europe\ncumulative as of {date}"),
              legend.position = c("right", "top"),
              frame = FALSE) +
    #tm_shape(countries, bbox = death_pop) +
    #tm_borders() +
    tm_credits(glue("http://r.iresmi.net/
                  bisquare kernel smoothing {radius / 1000} km on {pixel / 1000} km grid
                  classif. kmeans, {format(st_crs(countries))}
                  data European Centre for Disease Prevention and Control / map Naturalearth"),
               size = .5,
               position = c(.5, .025))

  message("saving map...")
  tmap_save(m, glue("results/animation_eu/covid_eu_{date}.png"),
            width = 800, height = 800, scale = .4,)
}

covid |>
  filter(date_rep >= "2020-03-15") |>
  pull(date_rep) |>
  unique() |>
  walk(image_animation)

animation <- glue("results/deaths_covid19_eu_{max(covid$date_rep)}.gif")

dir_ls("results/animation_eu") |>
  map(image_read) |>
  image_join() |>
  #image_scale("500x500") |>
  image_morph(frames = 1) |>
  image_animate(fps = 2, optimize = TRUE) |>
  image_write(animation)
