# packages ----------------------------------------------------------------

library(tidyverse)
library(httr)
library(fs)
library(sf)
library(readxl)
library(janitor)
library(glue)
library(geofacet)

# sources -----------------------------------------------------------------

# https://www.data.gouv.fr/fr/datasets/donnees-hospitalieres-relatives-a-lepidemie-de-covid-19/
fichier_covid <- "donnees/covid.csv"
url_donnees_covid <- "https://www.data.gouv.fr/fr/datasets/r/63352e38-d353-4b54-bfd1-f1b3ee1cabd7"

# https://www.insee.fr/fr/statistiques/2012713#tableau-TCRD_004_tab1_departements
fichier_pop <- "donnees/pop.xlsx"
url_donnees_pop <- "https://www.insee.fr/fr/statistiques/fichier/2012713/TCRD_004.xlsx"

# Adminexpress : à télécharger manuellement
# https://geoservices.ign.fr/documentation/diffusion/telechargement-donnees-libres.html#admin-express
aex <- path_expand("~/data/adminexpress/adminexpress_cog_simpl_000_2022.gpkg")


# config ------------------------------------------------------------------

options(scipen = 999)

force_download <- FALSE # retélécharger même si le fichier existe et a été téléchargé aujourd'hui ?


# téléchargement -------------------------------------------------

if (!dir_exists("donnees")) dir_create("donnees")

if (!file_exists(fichier_covid) |
      file_info(fichier_covid)$modification_time < Sys.Date() |
      force_download) {
  GET(url_donnees_covid,
      progress(),
      write_disk(fichier_covid, overwrite = TRUE)) |>
    stop_for_status()
}

if (!file_exists(fichier_pop)) {
  GET(url_donnees_pop,
      progress(),
      write_disk(fichier_pop)) |>
    stop_for_status()
}

covid <- read_csv2(fichier_covid) |>
  filter(dep != "978")

pop <- read_xlsx(fichier_pop, skip = 2) |>
  clean_names() |>
  select(insee_dep = x1,
         x2020)

# adminexpress prétéléchargé
dep <- read_sf(aex, layer = "departement") |>
  filter(insee_dep < "971") |>
  st_transform(2154)


# construction de la grille ----------------------------------------

grid_fr <- dep |>
  select(insee_dep, nom) |>
  grid_auto(names = "nom", codes = "insee_dep", seed = 4) |>
  add_row(row = 8,
          col = 1,
          name_nom = "Guadeloupe",
          code_insee_dep = "971") |>
  add_row(row = 9,
          col = 1,
          name_nom = "Martinique",
          code_insee_dep = "972") |>
  add_row(row = 10,
          col = 1,
          name_nom = "Guyane",
          code_insee_dep = "973") |>
  add_row(row = 7,
          col = 13,
          name_nom = "Mayotte",
          code_insee_dep = "976") |>
  add_row(row = 8,
          col = 13,
          name_nom = "La Réunion",
          code_insee_dep = "974")

grid_fr[grid_fr$code_insee_dep %in% c("2A", "2B"), "col"] <- 13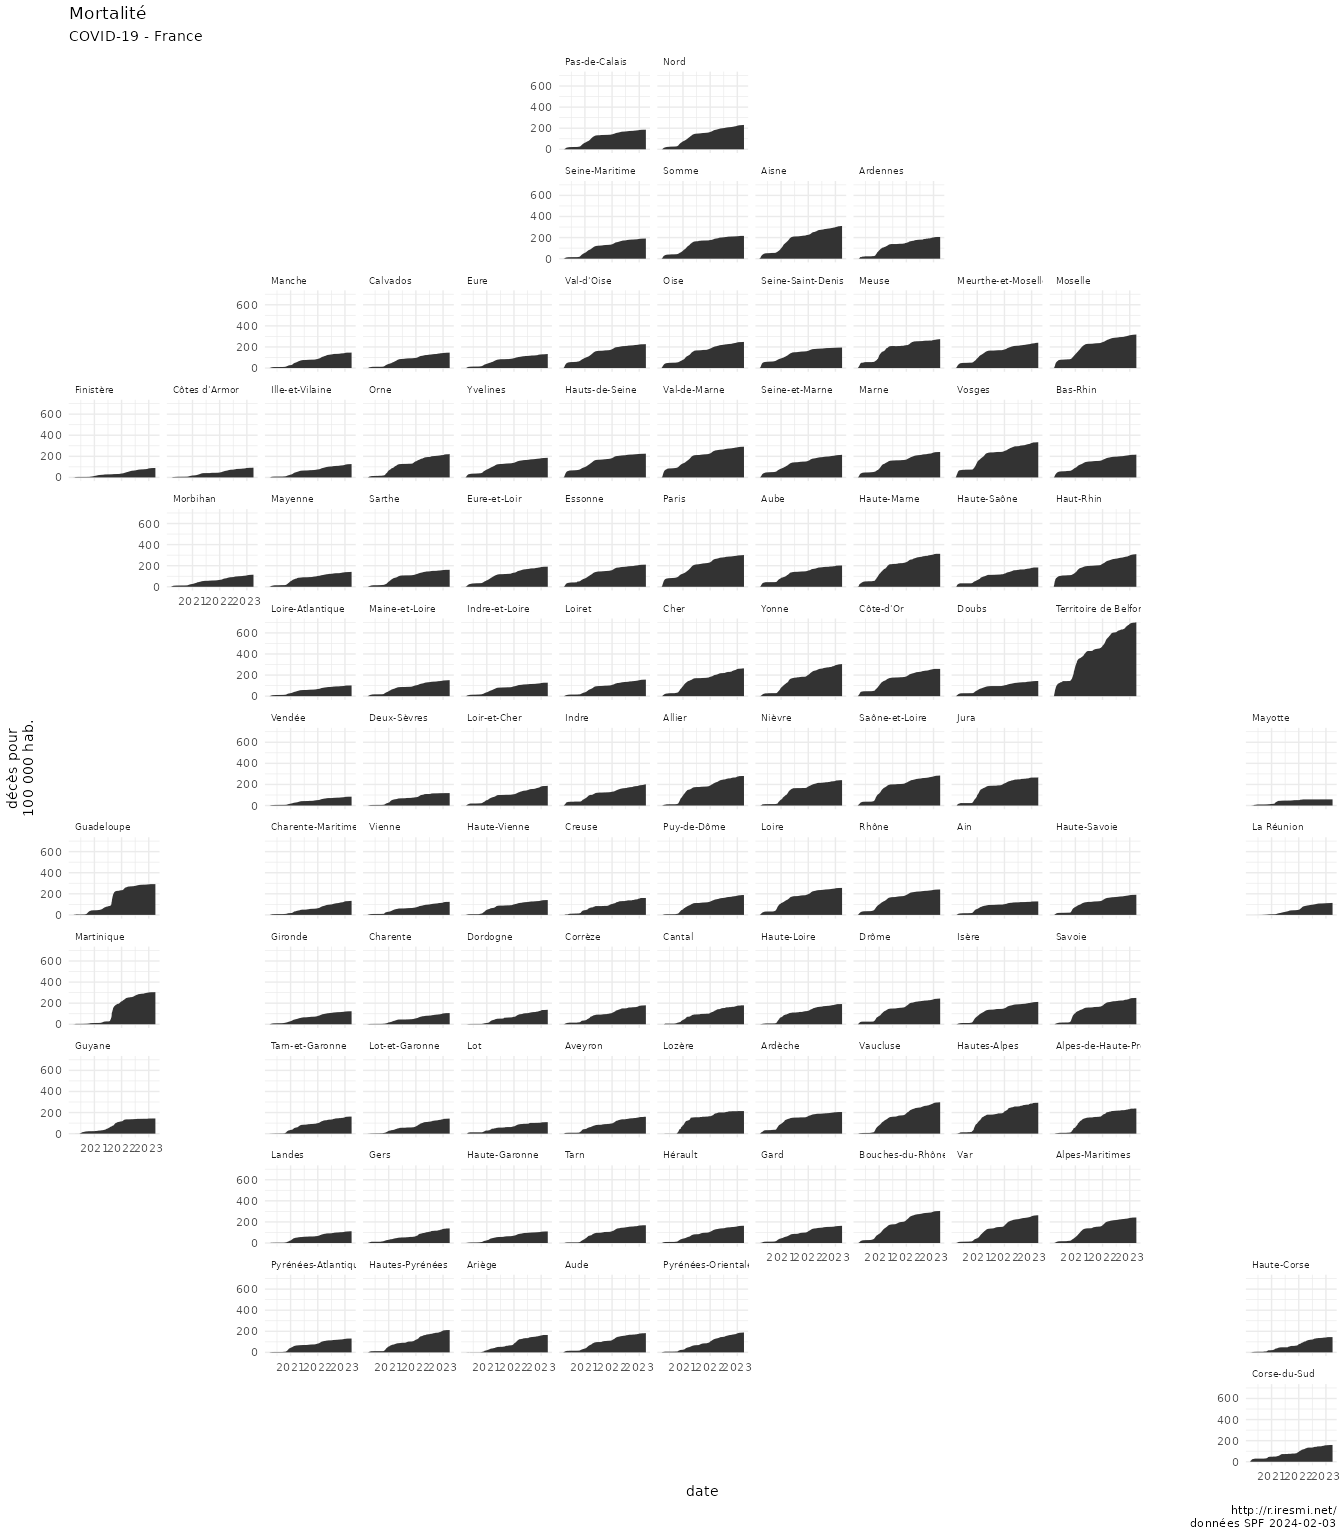
grid_fr[grid_fr$code_insee_dep %in% c("2A", "2B"), "row"] <- grid_fr[grid_fr$code_insee_dep %in% c("2A", "2B"), "row"] - 1The {geofacet} package allows to “arrange a sequence of plots of data for different geographical entities into a grid that strives to preserve some of the original geographical orientation of the entities”.
Like the previous post, it’s interesting if you view each entity as a unit and don’t care for its real size or weight, and don’t want to spend too much time manually finding the best grid.
We will again use the same COVID-19 dataset. We manually add the overseas départements once we have found the right grid (by trying different seeds) and adjust Corsica position.
covid |>
  filter(sexe == 0) |>
  select(insee_dep = dep,
         jour,
         deces = dc,
         reanim = rea,
         hospit = hosp) |>
  left_join(pop,
            join_by(insee_dep)) |>
  mutate(incidence = deces / x2020 * 1e5) |>
  left_join(grid_fr |>
              select(nom = name_nom,
                     insee_dep = code_insee_dep),
            by = join_by(insee_dep)) |>
  drop_na(insee_dep) |>
  ggplot() +
  geom_area(aes(jour, incidence)) +
  facet_geo(~ nom, grid = grid_fr) +
  labs(title = "Mortalité",
     subtitle = "COVID-19 - France",
     x = "date",
     y = "décès pour\n100 000 hab.",
     caption = glue("http://r.iresmi.net/\ndonnées SPF {Sys.Date()}")) +
  theme_minimal() +
  theme(strip.text = element_text(hjust = 0, size = 7))