library(tidyverse)
library(sf)
library(glue)
library(rnaturalearth)
library(units)

# grams of carbon dioxide-equivalents per passenger kilometer
# https://en.wikipedia.org/wiki/Fuel_economy_in_aircraft
co2_eq <- set_units(88, g/km)

# countries map from Naturalearth
countries <- ne_countries(scale = "small", returnclass = "sf")

# airport code and coordinates to geolocate itineraries
if (!file.exists("airports.rds")) {
  airport <- read_csv("https://raw.githubusercontent.com/jpatokal/openflights/master/data/airports.dat",
                      na = "\\N",
                      col_names = c("airport",
                                    "name",
                                    "city",
                                    "country",
                                    "iata",
                                    "icao",
                                    "latitude",
                                    "longitude",
                                    "altitude",
                                    "timezone",
                                    "dst",
                                    "tz",
                                    "type",
                                    "source")) %>%
    # Add Kai Tak, missing from the airport data
    add_row(iata = "HKGX",
            name = "Kai Tak",
            city = "Hong Kong",
            latitude = 22.328611,
            longitude = 114.194167) |>
    write_rds("airports.rds")
} else {
  airport <- read_rds("airports.rds")
}

# itineraries
flight <- read_delim("from-to
LYS-LHR
LHR-LYS
LYS-BOD
LYS-BOD
LYS-BOD
LYS-BOD
BOD-LYS
BOD-LYS
BOD-LYS
LYS-BOD
BOD-LYS
BOD-LGW
LHR-JNB
CPT-JNB
JNB-LHR
LHR-ORY
BOD-ORY
CDG-HKGX
HKGX-PER
SYD-HKGX
HKGX-CDG
ORY-CAY
CAY-BEL
BEL-BSB
BSB-MAO
MAO-VVI
VVI-LPB
LPB-MAO
MAO-BEL
BEL-CAY
CAY-XAU
XAU-CAY
CAY-XAU
XAU-CAY
CAY-XAU
XAU-CAY
CAY-ORY
NCE-MXP
MXP-NCE
CDG-CAY
CAY-MPY
MPY-CAY
CAY-CDG
CDG-HKG
HKG-SYD
SYD-HKG
HKG-SYD
TLN-ORY
CDG-CPH
CPH-ORY
ORY-TLN
CDG-YYZ
YYZ-SFO
SFO-YYZ
YYZ-CDG
ORY-TLN
TLN-ORY
LYS-AMS
AMS-SHJ
SHJ-KTM
KTM-SHJ
SHJ-AMS
AMS-LYS
CDG-AUH
AUH-MCT
MCT-KTM
KTM-PKR
PKR-KTM
KTM-MCT
MCT-AUH
AUH-CDG
GVA-FCO
FCO-GVA
CDG-RUN
RUN-CDG
GVA-KEF
KEF-GVA
CDG-ARN
ARN-KRN
KRN-ARN
ARN-CDG
CDG-RUN
RUN-CDG
CDG-RUN
RUN-CDG
CDG-TLS
LYS-CDG
CDG-PTP
PTP-CDG
CDG-LYS
", delim = "-")

# geolocate
flight_geo <- flight %>%
  left_join(airport, by = c("from" = "iata")) %>%
  left_join(airport, by = c("to" = "iata"), suffix = c("_from", "_to"))

# create lines
flight_lines <- flight_geo %>%
  mutate(line = glue("LINESTRING ({longitude_from} {latitude_from}, {longitude_to} {latitude_to})")) %>%
  st_as_sf(wkt = "line", crs = "EPSG:4326")

# create great circles and compute costs
flight_geo_gc <- flight_lines %>%
  st_segmentize(set_units(100, km)) %>%
  mutate(distance = set_units(st_length(line), km),
         co2 = set_units(distance * co2_eq, t))

# totals
total_flight <- flight_geo_gc %>%
  st_drop_geometry() %>%
  summarise(total_distance = sum(distance, na.rm = TRUE),
            total_co2 = sum(co2, na.rm = TRUE))
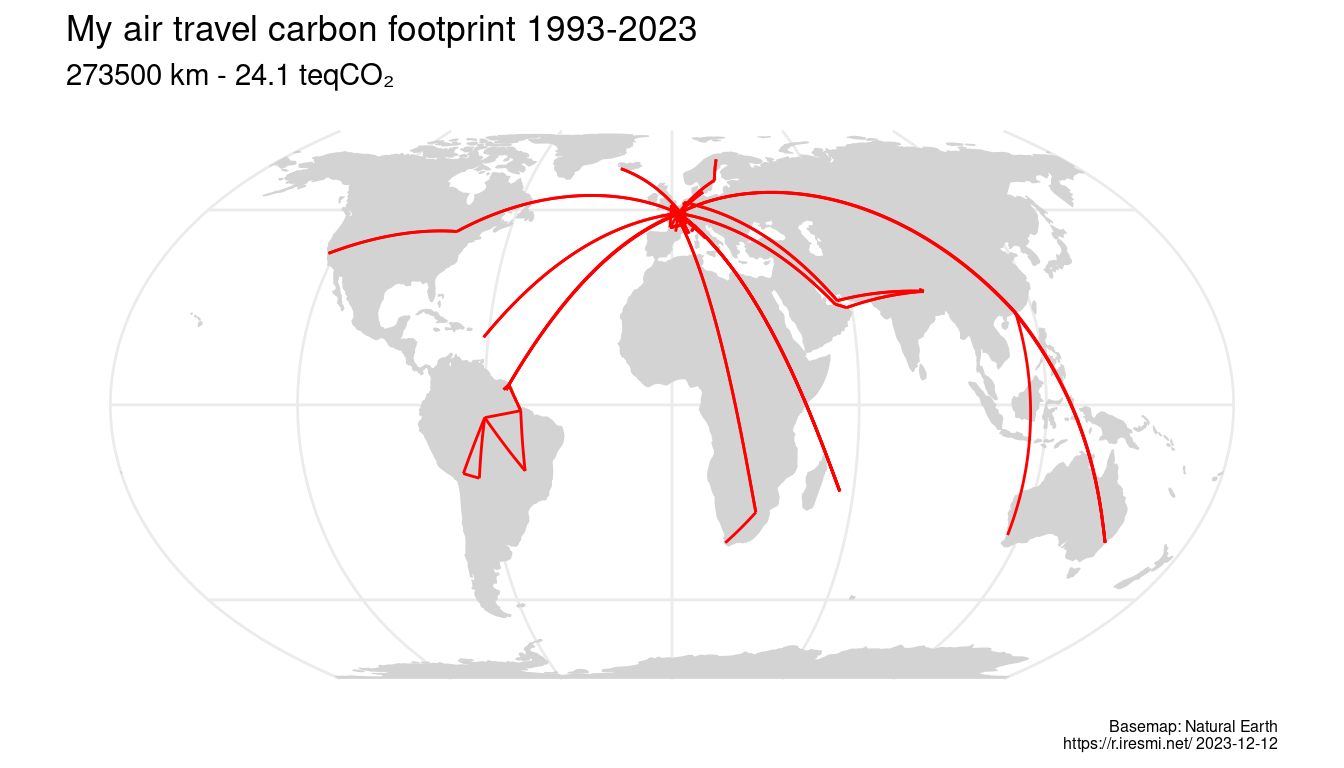
Day 2 of 30DayMapChallenge: « Lines » (previously).
ggplot() +
  geom_sf(data = countries, fill = "lightgrey", color = "lightgrey") +
  geom_sf(data = flight_geo_gc, color = "red") +
  # geom_sf(data = flight_lines, color = "blue") +
  coord_sf(crs = "+proj=eqearth") +
  # coord_sf(crs = "+proj=robin") +
  # coord_sf(crs = "+proj=fouc") +
  # coord_sf(crs = "+proj=eck1") +
  # coord_sf(crs = "+proj=moll") +
  # coord_sf(crs = "+proj=bonne +lat_1=10") +
  # coord_sf(crs = "+proj=laea") +
  labs(title = "My air travel carbon footprint 1993-2023",
       subtitle = glue("{round(total_flight$total_distance, -2)} km - {round(total_flight$total_co2, 1)} teqCO₂"),
       caption = glue("Basemap: Natural Earth
                       https://r.iresmi.net/ {Sys.Date()}")) +
  theme_minimal()+
  theme(plot.caption = element_text(size = 6))