library(tidyverse)
library(sf)
library(osmdata)
library(ggspatial)
library(glue)

ua_bbox <- getbb("kiev, ukraine", featuretype = "city")

if (!file.exists("osm.rds")) {
  ua <- opq(ua_bbox) |>
    add_osm_features(features = c(
      '"highway"="motorway"',
      '"highway"="trunk"',
      '"highway"="primary"',
      '"highway"="secondary"',
      '"highway"="tertiary"',
      '"highway"="motorway_link"',
      '"highway"="trunk_link"',
      '"highway"="primary_link"',
      '"highway"="secondary_link"',
      '"highway"="tertiary_link"',
      '"highway"="motorway_junction"',
      '"highway"="unclassified"',
      '"highway"="service"',
      '"highway"="pedestrian"',
      '"highway"="living_street"',
      '"highway"="residential"')) |>
    osmdata_sf() |>
    pluck("osm_lines") |>
    select(osm_id) |>
    write_rds("osm.rds")
} else {
  ua <- read_rds("osm.rds")
}
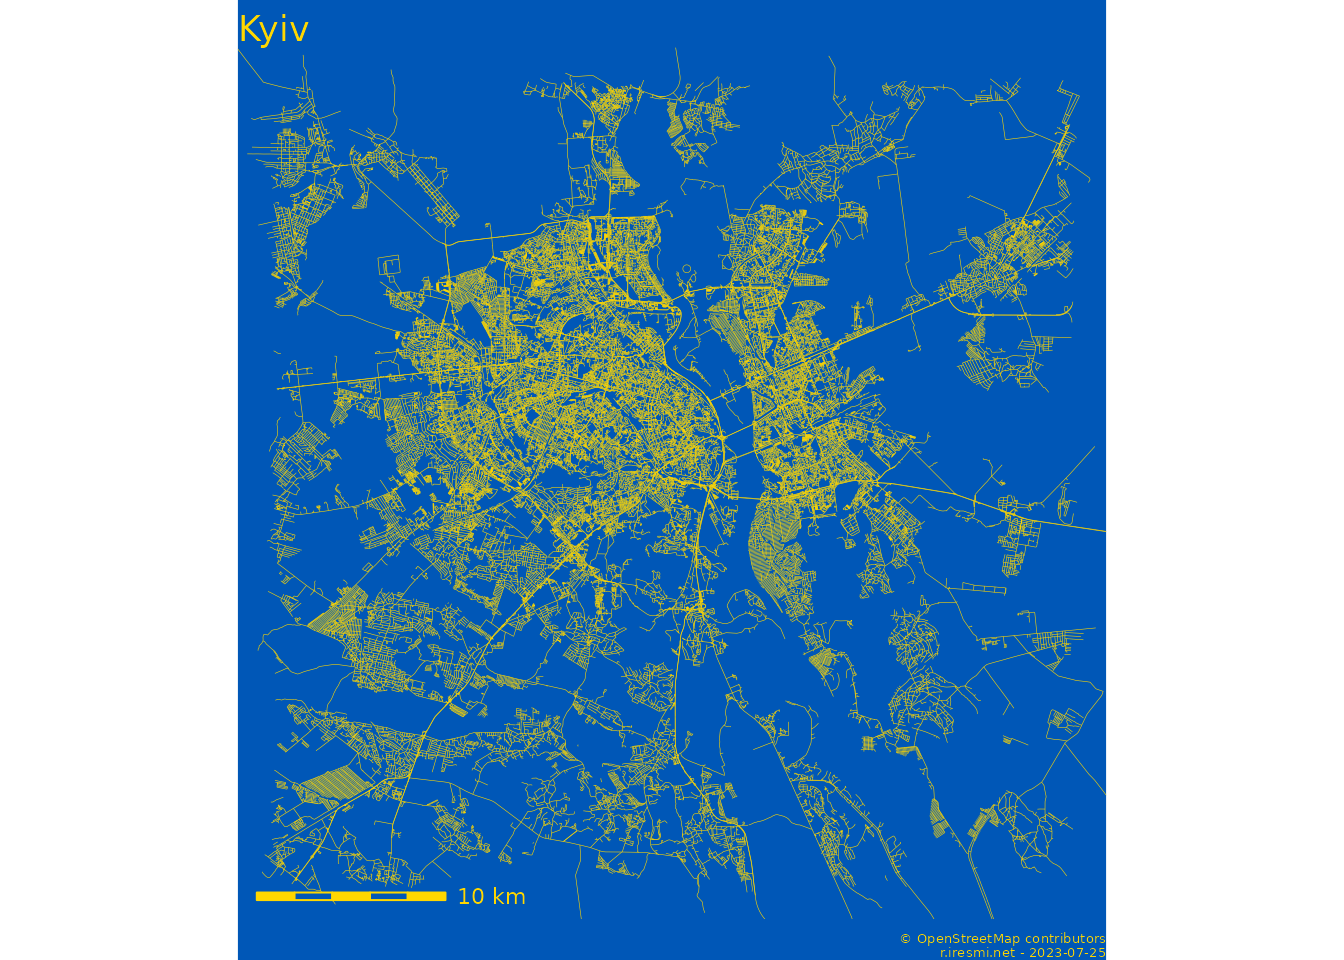
Day 5 of 30DayMapChallenge: « Ukraine » (previously).
Using {osmdata} to extract streets:
ua |>
  st_set_crs("EPSG:4326") |>
  ggplot() +
  geom_sf(color = "#FFD700", linewidth = 0.1) +
  annotation_scale(bar_cols =  c("#FFD700", "#0057B7"),
                   line_col = "#FFD700",
                   text_col = "#FFD700",
                   height = unit(0.1, "cm")) +
  coord_sf(xlim = ua_bbox[c(1, 3)],
           ylim = ua_bbox[c(2, 4)]) +
  labs(title = "Kyiv",
       caption = glue("© OpenStreetMap contributors
                      r.iresmi.net - {Sys.Date()}")) +
  theme_void() +
  theme(plot.background = element_rect(color = NA,
                                       fill = "#0057B7"),
        plot.title = element_text(color = "#FFD700"),
        plot.caption = element_text(size = 5,
                                    color = "#FFD700"))