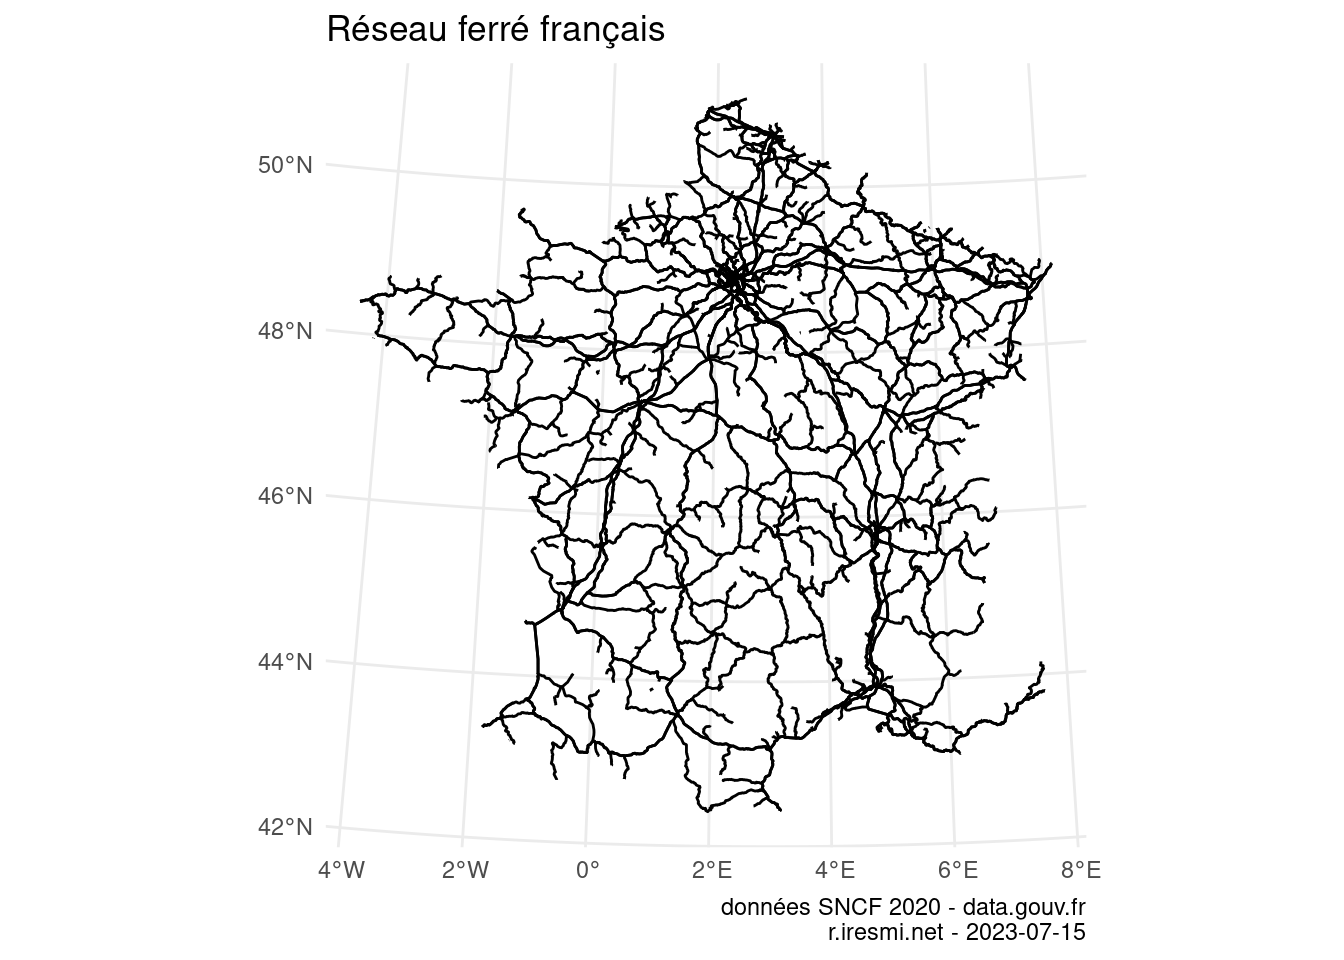
Day 6 of 30DayMapChallenge: « network » (previously).
Using GIS data directly from data.gouv.fr : railways network of France.
library(dplyr)
library(ggplot2)
library(sf)
library(glue)
library(httr)

# https://www.data.gouv.fr/fr/datasets/fichier-de-formes-des-voies-du-reseau-ferre-national/
if (!file.exists("fichier-de-formes-des-voies-du-reseau-ferre-national.shp")) {
  GET("https://www.data.gouv.fr/fr/datasets/r/71e38477-1166-4074-a532-c51f3f399b09",
      write_disk("data.zip"))
  unzip("data.zip")
}

network <- read_sf("fichier-de-formes-des-voies-du-reseau-ferre-national.shp") |>
  st_transform("EPSG:2154")

network |>
  ggplot() +
  geom_sf() +
  theme_minimal() +
  theme(plot.background = element_rect(fill = "white", color = NA)) +
  labs(title = "Réseau ferré français",
       caption = glue("données SNCF 2020 - data.gouv.fr
                      r.iresmi.net - {Sys.Date()}"))