library(tidyverse)
library(lubridate)
library(janitor)
library(sf)
library(glue)
library(rvest)
library(rnaturalearth)
library(showtext)

font_add_google(name = "Orbitron", family = "orbitron", regular.wt = 600)
showtext_auto()

url_data <- "https://en.wikipedia.org/wiki/List_of_rocket_launch_sites"

if (!file.exists("data.rds")) {
  # read all tables from the page
  # keep only those containing a country column
  # clean and merge
  launch <- read_html(url_data) |>
    html_table() |>
    keep(~ names(.x)[[1]] == "Country") |>
    map(~ mutate(.x, across(everything(), as.character))) |>
    reduce(bind_rows) |>
    clean_names()

  # keep only active sites : roughly "YYYY-"
  # and extract coordinates
  active <- launch |>
    filter(str_detect(operational_date, "\\d{4}s?–(\\[.*\\])?$")) |>
    mutate(x = str_extract(coordinates, "(?<=;\\s)\\-?\\d*\\.\\d*"),
           y = str_extract(coordinates, "\\-?\\d*\\.\\d*(?=;)")) |>
    select(country, location, coordinates, x, y) |>
    drop_na(x, y) |>
    st_as_sf(coords = c("x", "y"), crs = "EPSG:4326") |>
    write_rds("data.rds")
} else {
  active <- read_rds("data.rds")
}
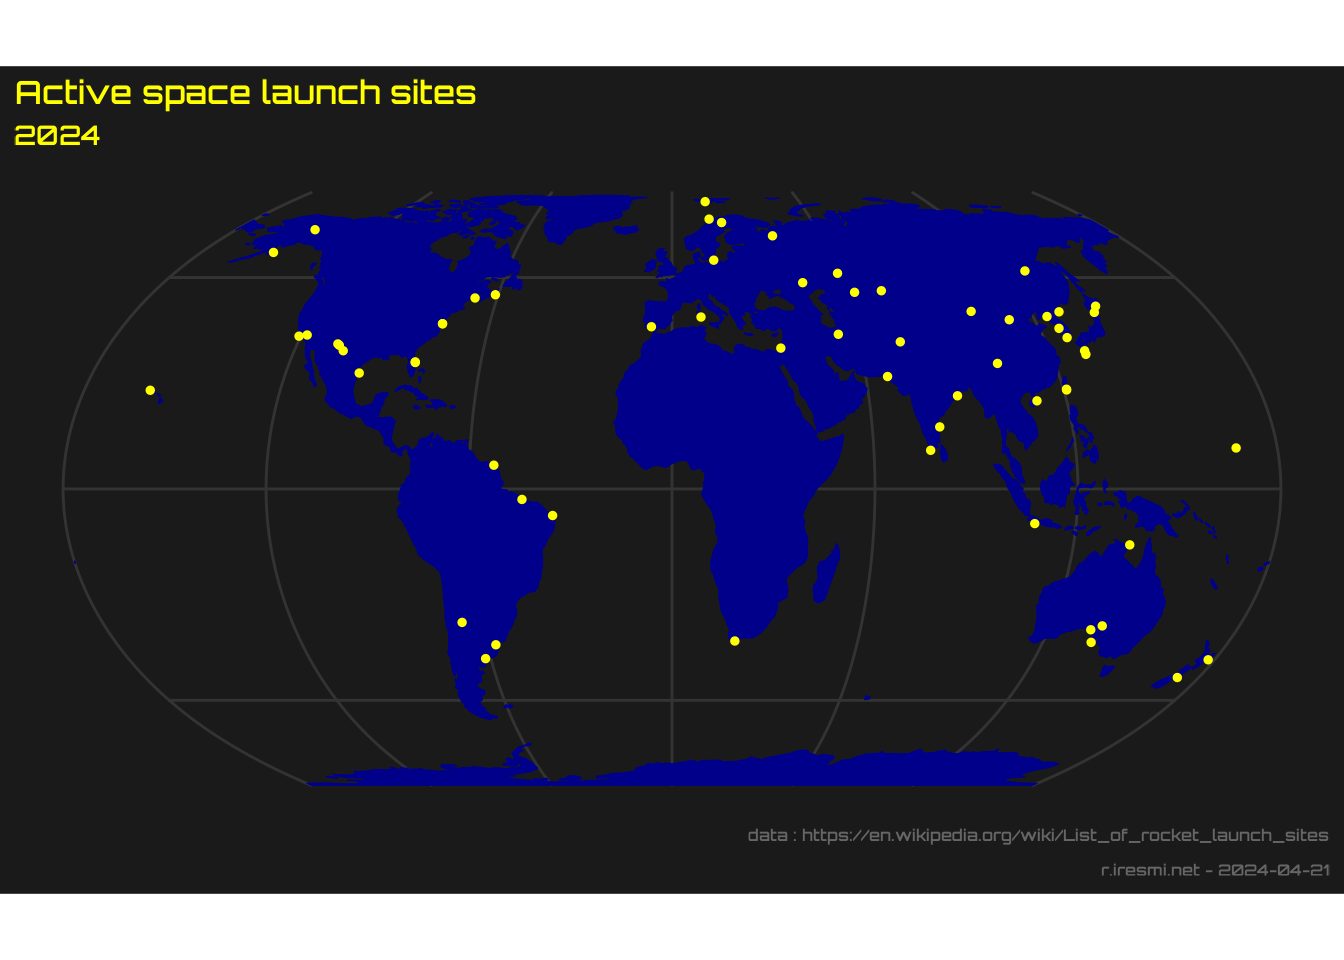
Day 9 of 30DayMapChallenge: « space » (previously).
Scrape and geolocate data from Wikipedia. We will map the active space launch sites.
ne_countries(scale = "small", type = "countries", returnclass = "sf") |>
  ggplot() +
  geom_sf(color = "darkblue", fill = "darkblue") +
  geom_sf(data = active, color = "yellow", size = 1) +
  coord_sf(crs = "+proj=eqearth") +
  labs(title = "Active space launch sites",
       subtitle = year(Sys.Date()),
       caption = glue("data : {url_data}
                      r.iresmi.net - {Sys.Date()}")) +
  theme(text = element_text(family = "orbitron",  color = "yellow", size = 20),
        plot.background = element_rect(fill = "grey10", color = NA),
        panel.background = element_blank(),
        panel.grid = element_line(color = "grey20"),
        plot.caption = element_text(size = 12, color = "grey40"))