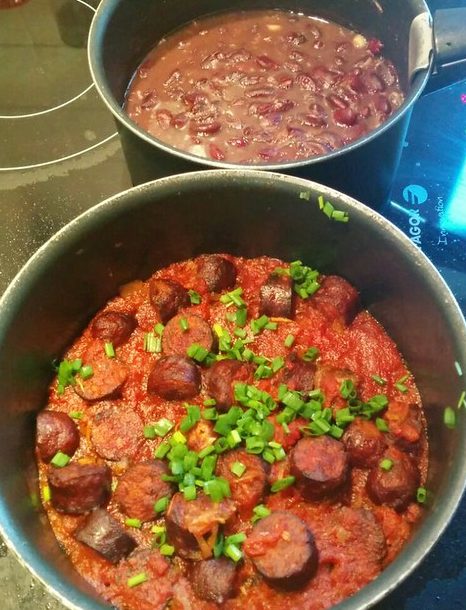
Day 15 of 30DayMapChallenge: « food » (previously).
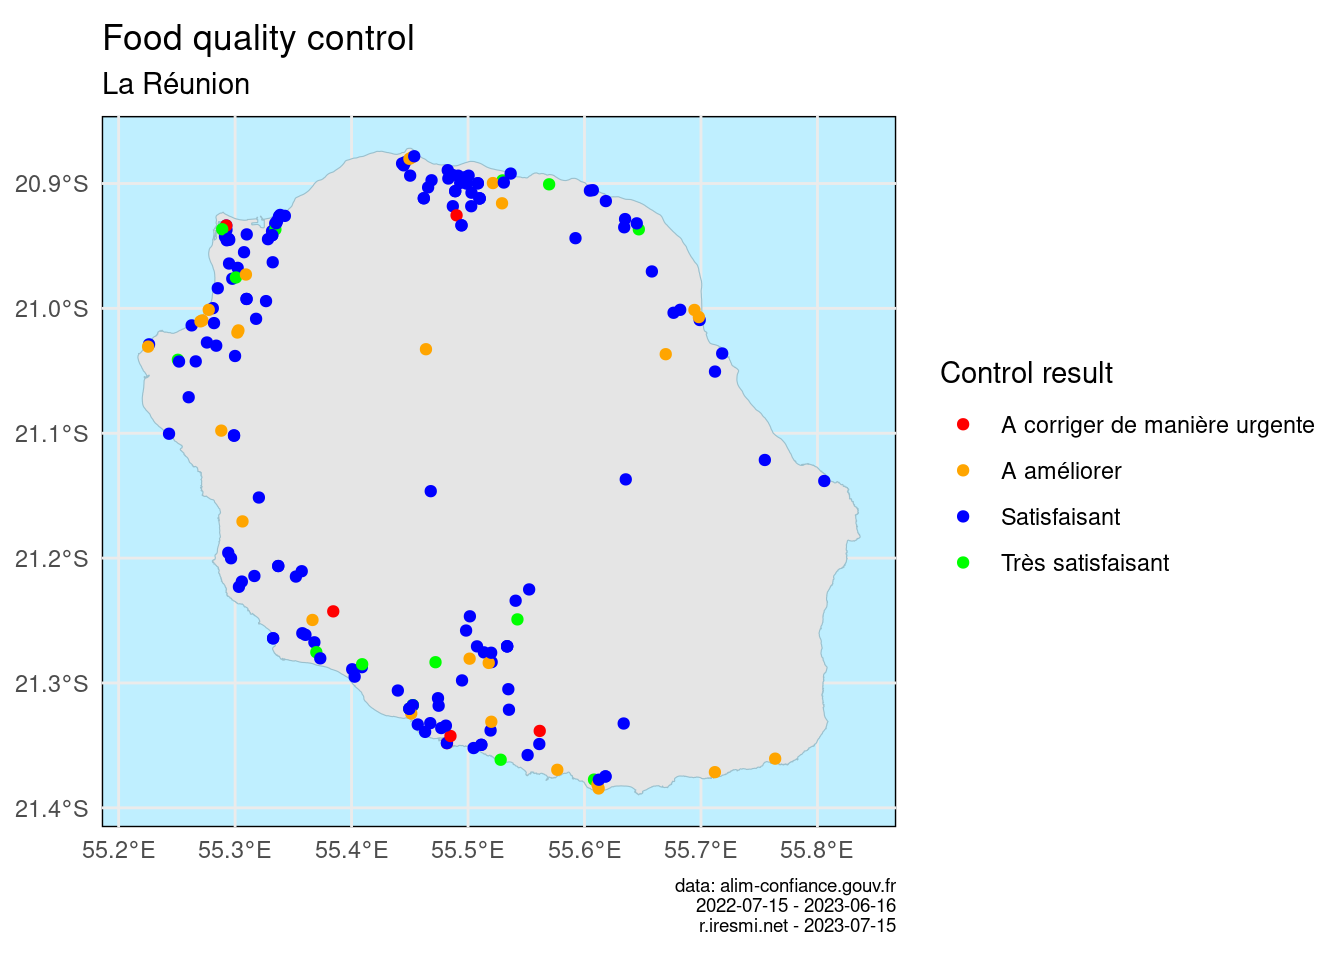
Results of State food controls in restaurants in La Réunion.
library(tidyverse)
library(sf)
library(janitor)
library(glue)

# https://geoservices.ign.fr/adminexpress
# COG
dep <- read_sf("~/data/adminexpress/ADMIN-EXPRESS-COG_3-1__SHP__FRA_WM_2022-04-15/ADMIN-EXPRESS-COG/1_DONNEES_LIVRAISON_2022-04-15/ADECOG_3-1_SHP_WGS84G_FRA/DEPARTEMENT.shp") |>
  filter(INSEE_DEP == "974")

# https://dgal.opendatasoft.com/explore/dataset/export_alimconfiance/download/?format=shp
alim <- read_sf("~/data/alimconfiance/export_alimconfiance.shp") |>
  clean_names() |>
  filter(str_sub(code_postal, 1, 3) == "974") |>
  mutate(date_inspec = ymd_hms(date_inspec),
         synthese_ev = factor(synthese_ev, levels = c("A corriger de manière urgente",
                                                      "A améliorer",
                                                      "Satisfaisant",
                                                      "Très satisfaisant")))
alim |>
  ggplot() +
  geom_sf(data = dep,  fill = "grey90", color = "lightblue3") +
  geom_sf(aes(color = synthese_ev)) +
  scale_color_manual(values = c(
    "A corriger de manière urgente" = "red",
    "A améliorer" = "orange",
    "Satisfaisant" = "blue",
    "Très satisfaisant" = "green")) +
  labs(title = "Food quality control",
       subtitle = "La Réunion",
       color = "Control result",
       caption = glue("data: alim-confiance.gouv.fr
                      {min(alim$date_inspec)} - {max(alim$date_inspec)}
                      r.iresmi.net - {Sys.Date()}")) +
  theme_minimal() +
  theme(panel.background = element_rect(fill = "lightblue1"),
        plot.caption = element_text(size = 7))