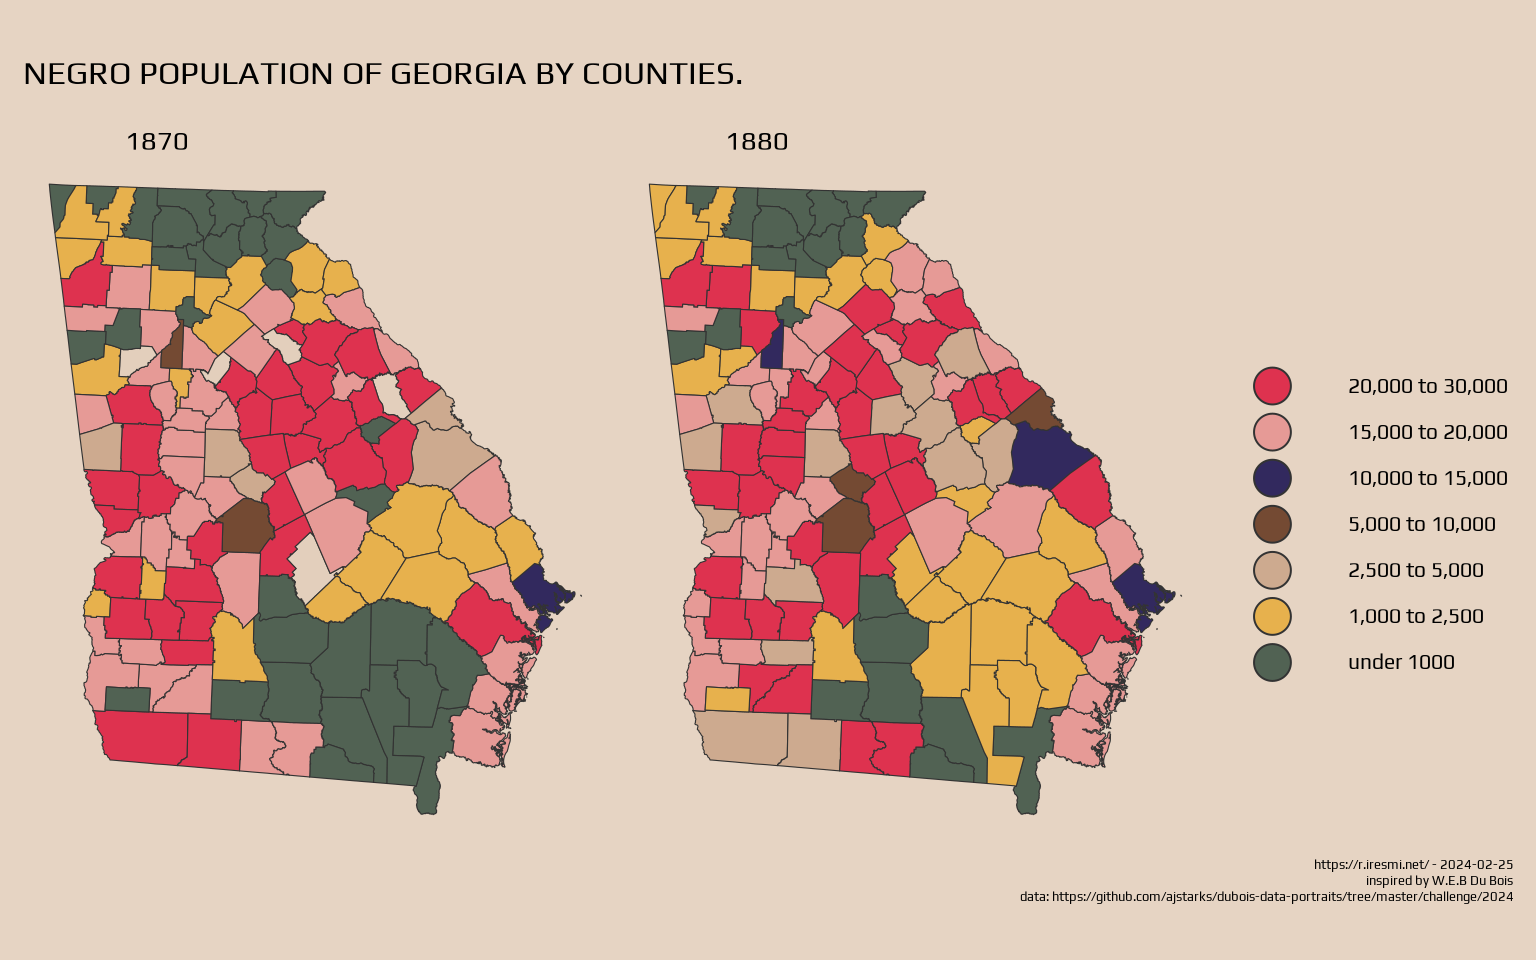
Recreating the the data visualization of W.E.B Du Bois from the 1900 Paris Exposition using modern tools. See the challenge presentation.
Setup
library(tidyverse)
library(sf)
library(janitor)
library(showtext)
library(glue)

font_add_google("Play", family = "dubois")
showtext_auto()
Data
Correcting a typo and reprojecting to UTM…
counties <- read_sf("data/DuBoisChallenge - Georgia Counties w 1870 & 1880 data.shp") |>
  clean_names() |>
  pivot_longer(starts_with("data"),
               names_to = "year",
               values_to = "pop",
               names_pattern = "(\\d{4})") |>
  mutate(pop = if_else(pop == "> 1000", "< 1000", pop)) |>
  st_transform("EPSG:32617")
Map
counties |>
  ggplot() +
  geom_sf(aes(fill = pop),
          key_glyph = "dotplot",
          color = "#333333") +
  facet_wrap(~ year) +
  scale_fill_manual(
    values = list(
      "< 1000"        = "#516253",
      "1000 - 2500"   = "#E7B14D",
      "2500 - 5000"   = "#E69A96",
      "5000 - 10000"  = "#DE324F",
      "10000 - 15000" = "#CDAA8F",
      "15000 - 20000" = "#744A33",
      "20000 - 30000" = "#32295E"),
    labels = c(
      "under 1000",
      "1,000 to 2,500",
      "2,500 to 5,000",
      "5,000 to 10,000",
      "10,000 to 15,000",
      "15,000 to 20,000",
      "20,000 to 30,000"),
    na.value = "#E3CFBC") +
  guides(fill = guide_legend(keywidth = unit(13, units = "mm"),
                             reverse = TRUE)) +
  labs(title = str_to_upper("Negro Population of Georgia by counties."),
       subtitle = "",
       fill = "",
       caption = glue("https://r.iresmi.net/ - {Sys.Date()}
                      inspired by W.E.B Du Bois
                      data: https://github.com/ajstarks/dubois-data-portraits/tree/master/challenge/2024")) +
  theme_void() +
  theme(text = element_text(family = "dubois", size = 20, lineheight = .5),
        plot.title = element_text(size = 25),
        plot.background = element_rect(fill = "#E6D4C3", color = NA),
        plot.margin = margin(0, .3, 0.1, .3, "cm"),
        plot.caption = element_text(size = 10),
        plot.caption.position = "plot",
        strip.text = element_text(size = 20, hjust = 0.2))