library(tidyverse)
library(sf)
library(glue)
library(janitor)
library(rnaturalearth)
library(ggspatial)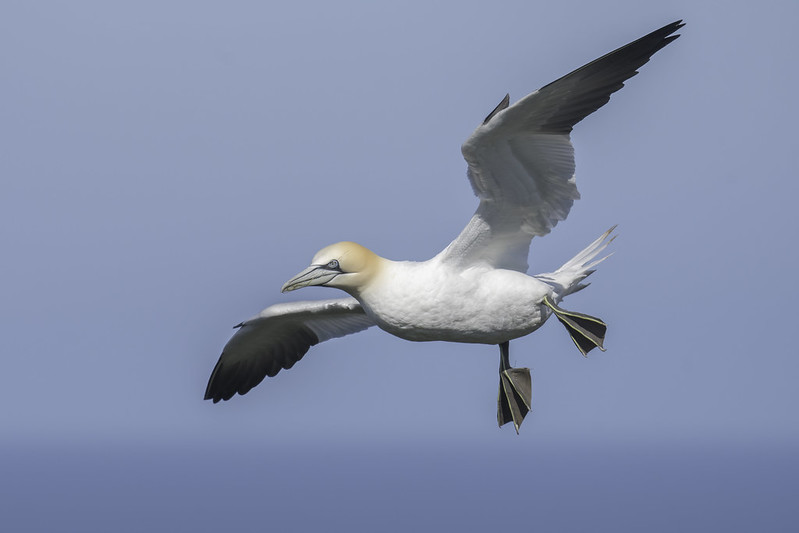
Day 18 of 30DayMapChallenge: « Atmosphere » (previously).
Thanks to a post from @ClareEGordon@mastodon.social I found a dataset (Warwick-Evans et al. 2017) that could (vaguely) relates to the theme of atmosphere.
It describes the trajectories of GPS tracked Northern Gannets (Morus bassanus L.) breeding on Alderney in the English Channel.
Setup
Data
# GPS data
# https://datarepository.movebank.org/entities/datapackage/8e78d67d-24d9-49cd-9f0a-9b2bccaa70fa
mb_file <- "northern_gannets-les_etacs-alderney.csv"

if (!file.exists(mb_file)) {
  download.file("https://datarepository.movebank.org/bitstreams/dd6099d7-74fb-4be4-86e4-0e4b84177d65/download", mb_file)
}

mb <- read_csv(mb_file) |>
  clean_names()

# countries from Natural Earth
countries <- ne_countries(scale = 10, returnclass = "sf") |>
  st_make_valid()
Build polylines from points
The do_union = FALSE is important to keep the points’ ordering in the line.
mb_traj <- mb |>
  st_as_sf(coords = c("location_long", "location_lat"), crs = "EPSG:4326") |>
  group_by(tag_local_identifier) |>
  summarise(do_union = FALSE) |>
  st_cast("LINESTRING") |>
  st_transform("EPSG:3035")
Map
bbox <- st_bbox(mb_traj)
min_year <- year(min(mb$timestamp))
max_year <- year(max(mb$timestamp))

mb_traj |>
  ggplot() +
  geom_sf(data = countries, color = NA) +
  geom_sf(aes(color = tag_local_identifier), alpha = 0.4) +
  geom_sf(data = countries, fill = NA) +
  annotation_scale(height = unit(1, "mm"),
                   text_col = "darkgrey", line_col = "grey",
                   bar_cols = c("white", "grey")) +
  coord_sf(xlim = bbox[c(1, 3)], ylim = bbox[c(2, 4)]) +
  labs(title = "Northern Gannets tracking study",
       subtitle = glue("Alderney, {min_year} - {max_year}"),
       caption = glue("{st_crs(mb_traj)$Name}
                    Data: DOI:10.5441/001/1.30r98tb3
                    Basemap: Natural Earth
                    https://r.iresmi.net/ {Sys.Date()}")) +
  theme(legend.position = "none",
        plot.caption = element_text(size = 6), )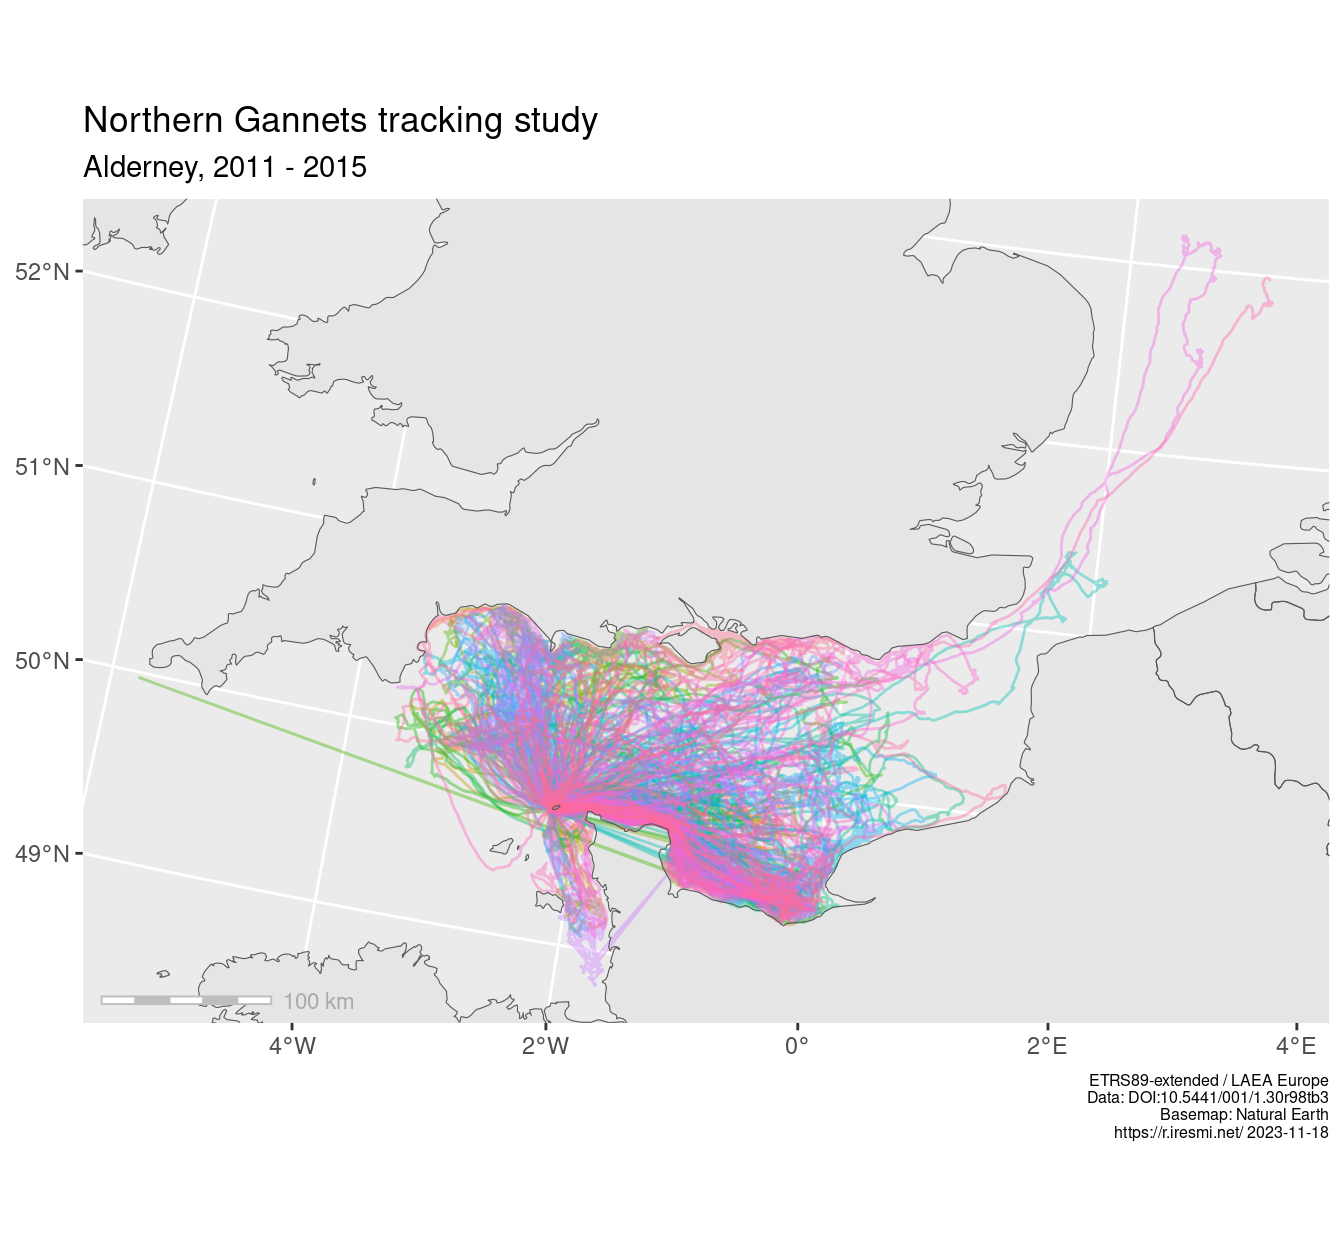
Next stage would be to make an animation like @ClareEGordon@mastodon.social post with {gganimate}…
References
Warwick-Evans, Victoria, Louise M. Soanes, Roland D. Gauvain, Phil W. Atkinson, John P. Y. Arnould, and Jon A. Green. 2017. Data from: Changes in Behaviour Drive Inter‐annual Variability in the at‐sea Distribution of Northern Gannets. Movebank Data Repository. https://doi.org/10.5441/001/1.30R98TB3.