library(tidyverse)
library(rnaturalearth)
library(sf)
library(glue)
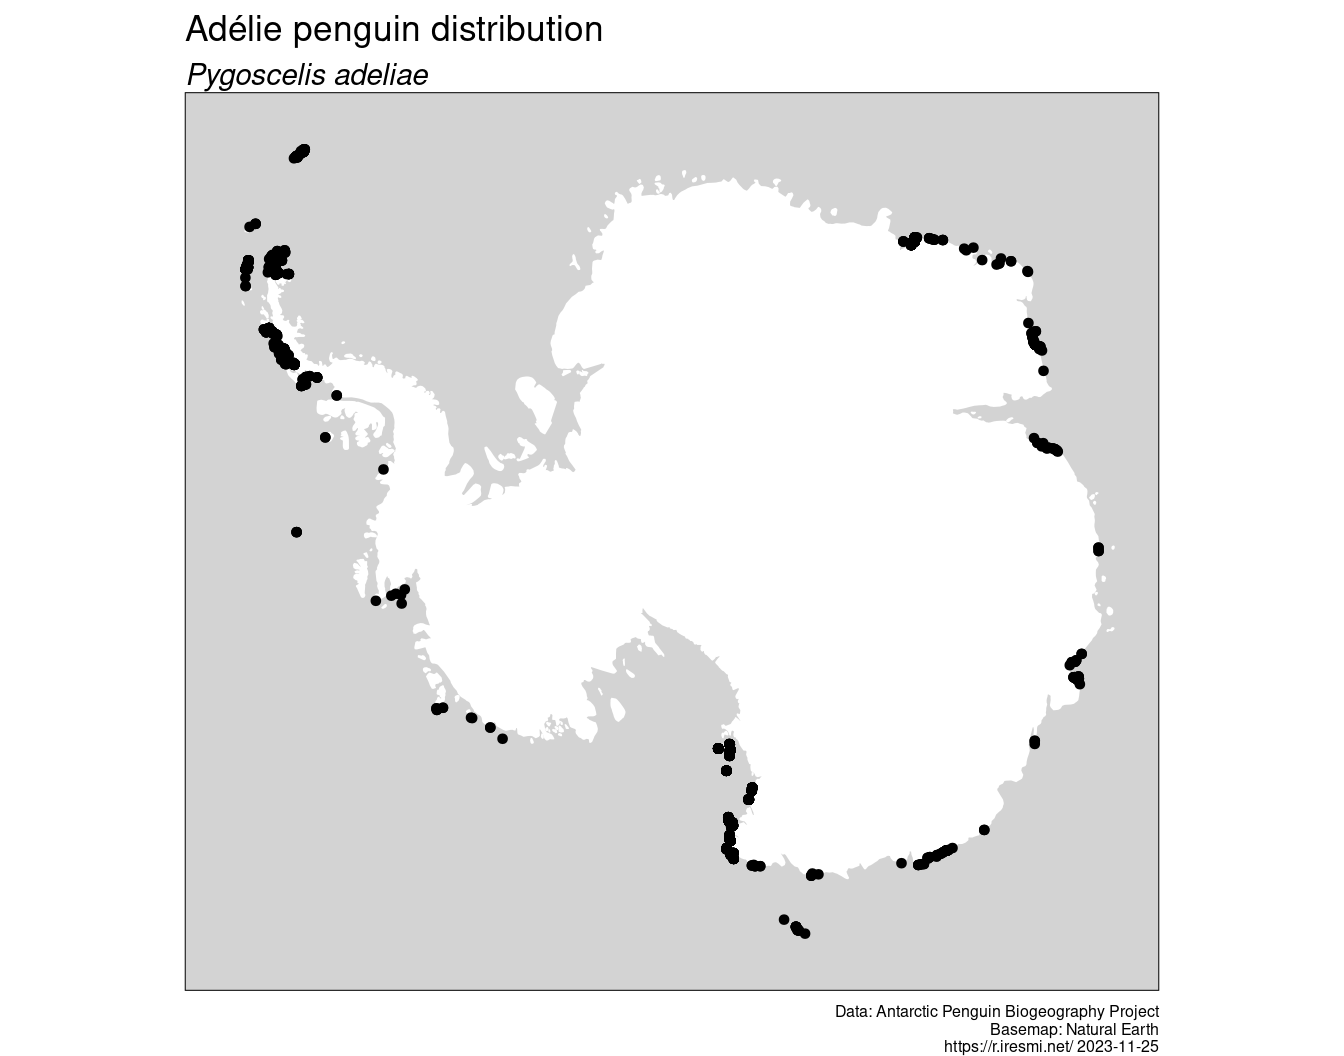
library(ggtext)Days 24 & 25 of 30DayMapChallenge: « Black & white » & « Antarctica » (previously).
All #RStats enthusiasts seem to love Penguins (at least as a toy dataset), so I made a map. By chance it’s also centered on Antarctica…
Setup
Data
Data produced by the Antarctic Penguin Biogeography Project (Che-Castaldo, Humphries, and Lynch 2022) and downloaded from MAPPPD (Mapping Application for Penguin Populations and Projected Dynamics).
penguin_file <- "penguins.csv"
if (!file.exists(penguin_file)) {
  download.file("https://www.penguinmap.com/mapppd/DownloadAll/",
                penguin_file)
}

penguins <- read_csv(penguin_file) |>
  st_as_sf(coords = c("longitude_epsg_4326", "latitude_epsg_4326"),
        crs = "EPSG:4326") |>
  st_transform("EPSG:3031")

adelie <- penguins |>
  filter(common_name == "adelie penguin")

countries <- ne_countries(scale = 50, returnclass = "sf") |>
  st_transform("EPSG:3031")
Map
bbox <- adelie |>
  st_buffer(1e5) |>
  st_bbox()

adelie |>
  ggplot() +
  geom_sf(data = countries, fill = "white", color = "white") +
  geom_sf(size = 1.2) +
  coord_sf(xlim = bbox[c(1, 3)],
           ylim = bbox[c(2, 4)]) +
  labs(title = "Adélie penguin distribution",
       subtitle = "*Pygoscelis adeliae*",
       x = "",
       y = "",
       caption = glue("Data: Antarctic Penguin Biogeography Project
                       Basemap: Natural Earth
                       https://r.iresmi.net/ {Sys.Date()}")) +
  theme_void() +
  theme(plot.subtitle = element_markdown(),
        plot.caption = element_text(size = 6),
        panel.background = element_rect(fill = "lightgrey"))
References
Che-Castaldo, Christian, Grant Humphries, and Heather Lynch. 2022. “Antarctic Penguin Biogeography Project: Database of Abundance and Distribution for the Adélie, Chinstrap, Gentoo, Emperor, Macaroni, and King Penguin South of 60 S.” SCAR - AntOBIS. https://doi.org/10.48361/ZFTXKR.
