library(tidyverse)
library(sf)
library(janitor)
library(ggspatial)
library(glue)

# final projection
proj <- "EPSG:3035"

# Data: No direct URL
# https://stats.agriculture.gouv.fr/cartostat/#c=indicator&i=otex_2020_1.otefdd20&t=A02&view=map11
# -> Spécialisation de la production agricole en 2020 (12 postes)
# TABLEAU > ACTION > EXPORTER
otex <- read_csv2("data.csv", skip = 2) |>
  clean_names()

# classification
# https://agreste.agriculture.gouv.fr/agreste-web/methodon/N.1/!searchurl/listeTypeMethodon/
# Can you believe it? PDF only :-(
codes <- tribble(
  ~otefda, ~color,           ~orientation,
  "1516", "lightgoldenrod1", "Field crops",
  "2829", "lightskyblue",    "Market gardening or\nhorticulture",
  "3500", "darkorchid",      "Viticulture",
  "3900", "deeppink3",       "Fruit crops or\nother permanent crops",
  "4500", "dodgerblue3",     "Dairy cattle",
  "4600", "firebrick3",      "Cattle breeding and\nmeat production",
  "4700", "darkseagreen2",   "Combined dairy cattle,\nbreeding and meat production",
  "4800", "darkolivegreen4", "Sheep and/or goats and/or\nother herbivores",
  "5074", "hotpink",         "Pigs and/or poultry",
  "6184", "lightsalmon4",    "Polyculture and/or\nmixed farming",
  "9000", "snow3",           "Not classified") |>
  mutate(orientation = fct_reorder(orientation, otefda))
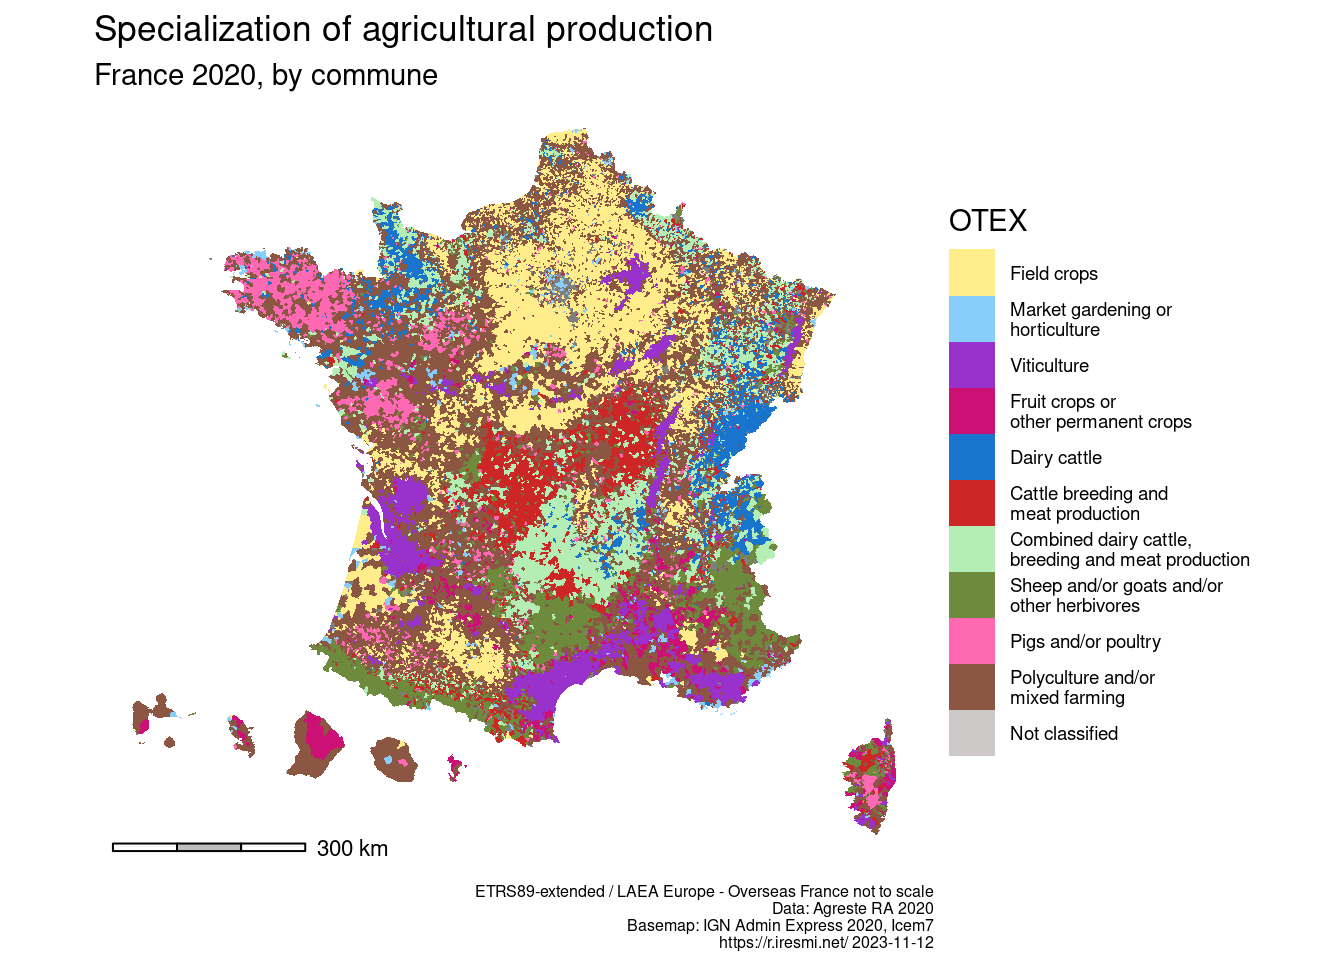
Day 13 of 30DayMapChallenge: « Choropleth » (previously).
Using the French 2020 census to map the specialization of agricultural production by commune.
# 2020 communes polygon data in GeoJSON
# From https://www.data.gouv.fr/fr/datasets/contours-des-communes-de-france-simplifie-avec-regions-et-departement-doutre-mer-rapproches/
# no need to download and unzip with gdal virtual filesystems
com <- read_sf("/vsizip/vsicurl/https://static.data.gouv.fr/resources/contours-des-communes-de-france-simplifie-avec-regions-et-departement-doutre-mer-rapproches/20201115-140349/a-com2020-geojson.zip") |>
  st_transform(proj)
com |>
left_join(otex, join_by(codgeo == code)) |>
left_join(codes, join_by(specialisation_de_la_production_agricole_en_2020_12_postes == otefda)) |>
ggplot() +
geom_sf(aes(fill = orientation), linewidth = 0) +
scale_fill_manual(name = "OTEX",
values = codes |>
select(orientation, color) |>
deframe()) +
labs(title = "Specialization of agricultural production",
subtitle = "France 2020, by commune",
caption = glue("{st_crs(proj)$Name} - Overseas France not to scale
Data: Agreste RA 2020
Basemap: IGN Admin Express 2020, Icem7
https://r.iresmi.net/ {Sys.Date()}")) +
annotation_scale(height = unit(1, "mm"), bar_cols = c("white", "grey")) +
theme_void() +
theme(plot.margin = margin(0, .3, 0.1, .3, "cm"),
plot.caption = element_text(size = 6),
legend.text = element_text(size = 7),
plot.background = element_rect(color = NA, fill = "white"))