library(terra)
library(readr)
library(dplyr)
library(tidyr)

thick <- read_fwf("thick_5km_corrected",
                  guess_max = 1e4) |>
  mutate(row = ceiling(row_number() / 31)) |>
  group_by(row) |>
  group_modify(~ as_tibble(as.vector(t(as.matrix(.x))))) |>
  ungroup() |>
  mutate(name = rep(paste0("x", 1:310), 561)) |>
  drop_na(value) |>
  pivot_wider(values_from = value,
              names_from = name) |>
  arrange(desc(row)) |>
  select(-row) |>
  as.matrix() |>
  rast(crs = "+proj=stere +lat_0=90 +lat_ts=71 +lon_0=-39 +x_0=0 +y_0=0 +datum=WGS84 +units=m +no_defs +type=crs")

ext(thick) <- c(-800000, 700000, -3400000, -600000)Day 11 of 30DayMapChallenge: « Arctic » (previously).
We’ll use the Greenland 5 km DEM, Ice Thickness, and Bedrock Elevation Grids (J. Bamber 2001) from J. L. Bamber, Layberry, and Gogineni (2001) and Layberry and Bamber (2001). Download here (after registration).
Data
The data needs some wrangling as the format is not straightforward: it’s a wrapped fixed width ASCII file (check the user guide). We need to make one row out of every 31 lines of the file, reverse the order of the lines and give the correct projection and extent.
Map
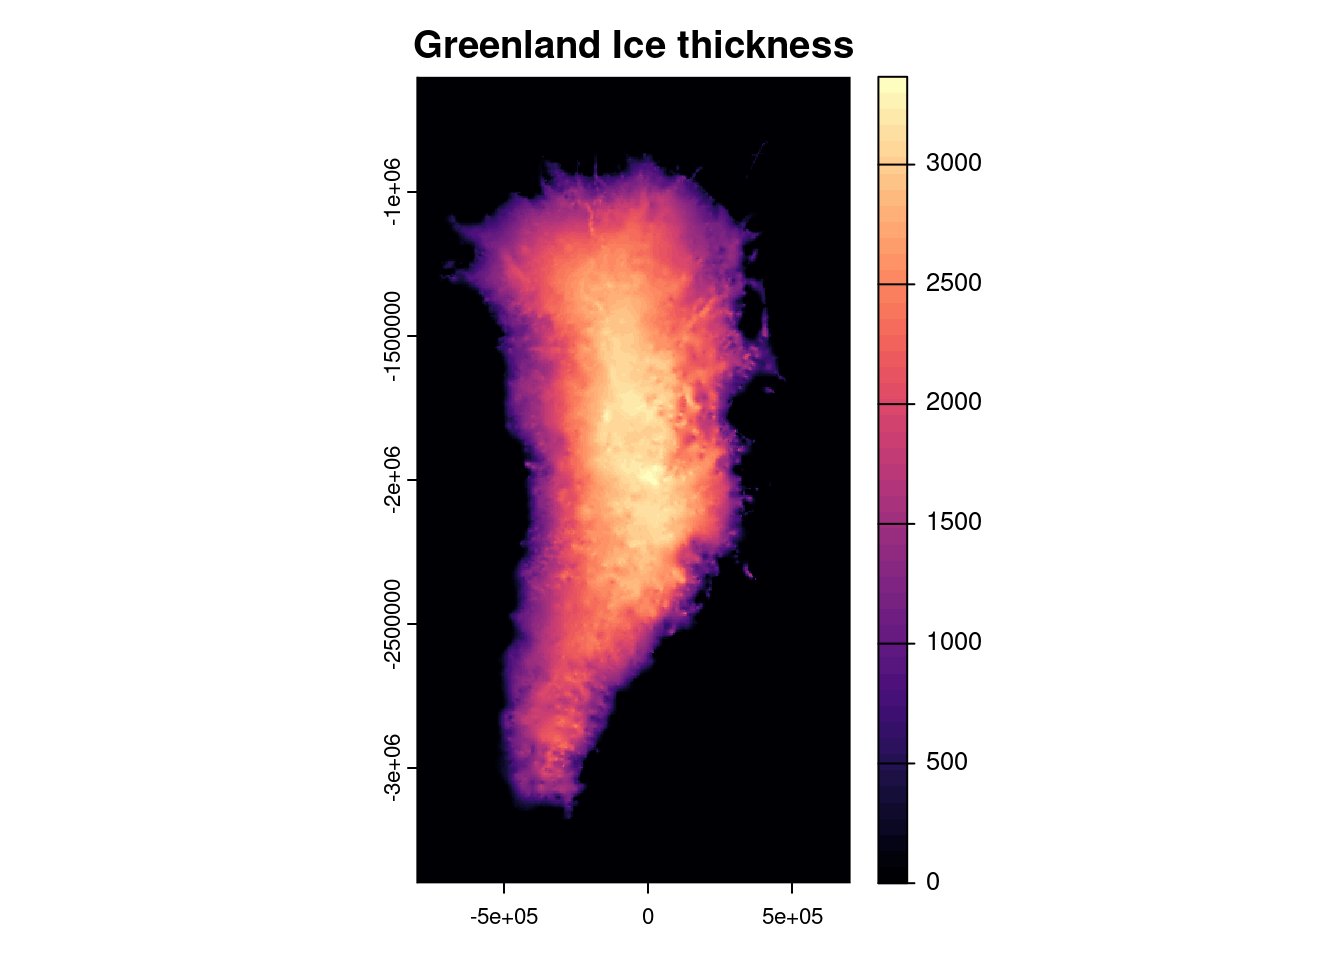
Here is the raw map in a polar stereographic projection:
thick |>
  plot(main = "Greenland Ice thickness",
       col = map.pal("magma"))
And on an interactive map after reprojection:
library(leaflet)

# native resolution is 5 km, so at 66° N it's about 0.1 degree
# -75 - -10 = 65 ; 65 / 0.1 = 650 pixels wide
thick_wgs84 <- thick |>
  project(rast(nrows = 250, ncols = 650,
               xmin = -75, xmax = -10,
               ymin = 60, ymax = 85,
               crs = "EPSG:4326")) |>
  subst(x = _, 0, NA)

range_m <- c(0, max(values(thick_wgs84), na.rm = TRUE))
pal <- colorNumeric("magma", domain = range_m, na.color = "#ffffff00")
# fix the legend order:
pal_rev <- colorNumeric("magma", domain = range_m, na.color = "#ffffff00", reverse = TRUE)

leaflet() |>
  addTiles() |>
  addRasterImage(thick_wgs84,
                 colors = pal,
                 opacity = 0.5,
                 attribution = "Bamber, 2021 (NASA National Snow and Ice Data Center)") |>
  addLegend(pal = pal_rev,
            title = "Greenland<br />Ice thickness (m)",
            values = range_m,
labFormat = labelFormat(transform = function(x) sort(x + 500, decreasing = TRUE)))References
Bamber, J. L., R. L. Layberry, and S. P. Gogineni. 2001. “A New Ice Thickness and Bed Data Set for the Greenland Ice Sheet: 1. Measurement, Data Reduction, and Errors.” Journal of Geophysical Research: Atmospheres 106 (D24): 33773–80. https://doi.org/10.1029/2001JD900054.
Bamber, Jonathan. 2001. “Greenland 5 Km DEM, Ice Thickness, and Bedrock Elevation Grids, Version 1.” NASA National Snow and Ice Data Center Distributed Active Archive Center. https://doi.org/10.5067/01A10Z9BM7KP.
Layberry, R. L., and J. L. Bamber. 2001. “A New Ice Thickness and Bed Data Set for the Greenland Ice Sheet: 2. Relationship Between Dynamics and Basal Topography.” Journal of Geophysical Research: Atmospheres 106 (D24): 33781–88. https://doi.org/10.1029/2001JD900053.
