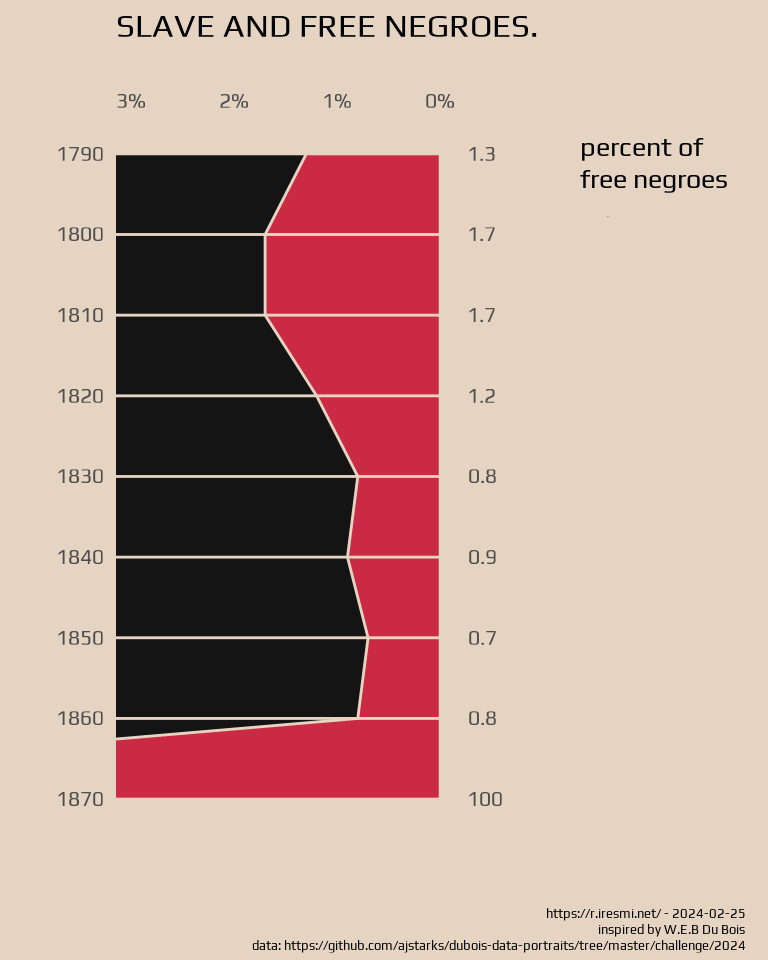
Recreating the the data visualization of W.E.B Du Bois from the 1900 Paris Exposition using modern tools. See the challenge presentation.
Setup
library(tidyverse)
library(janitor)
library(showtext)
library(glue)

font_add_google("Play", family = "dubois")
showtext_auto()
Data
data_02 <- read_csv("data.csv") |>
  clean_names() |>
  pivot_longer(c(slave, free), names_to = "status", values_to = "pcent") |>
  mutate(plot_pcent = case_when(year == 1870 & status == "slave" ~ 90,
                                year == 1870 & status == "free" ~ 10,
                                .default = pcent))
Plot
data_02 |>
  ggplot() +
  geom_area(aes(year, plot_pcent, fill = status),
            color = "#E6D4C3") +
  scale_x_reverse(breaks = seq(1790, 1870, by = 10),
                  sec.axis = dup_axis(labels = \(x) data_02 |>
                                        filter(year %in% x & status == "free") |>
                                        pull(pcent))) +
  scale_y_continuous(labels = \(x) rep("", times = length(x)),
                     sec.axis = dup_axis(labels = \(x) paste0(100 - x, "%"))) +
  scale_fill_manual(values = list("slave" = "#141414",
                                  "free"  = "#CB2A44")) +
  coord_flip(ylim = c(97, 100)) +
  labs(title = str_to_upper("slave and free negroes."),
       x = "",
       y = "",
       fill = "percent of\nfree negroes",
       caption = glue("https://r.iresmi.net/ - {Sys.Date()}
                      inspired by W.E.B Du Bois
                      data: https://github.com/ajstarks/dubois-data-portraits/tree/master/challenge/2024")) +
  theme_minimal() +
  theme(text = element_text(family = "dubois", size = 20, lineheight = .5),
        panel.background = element_rect(fill = NA, color = NA),
        panel.ontop = TRUE,
        panel.grid.major.x = element_blank(),
        panel.grid.minor.x = element_blank(),
        panel.grid.major.y = element_line(color = "#E6D4C3"),
        panel.grid.minor.y = element_blank(),
        legend.justification = "top",
        legend.text = element_text(size = 0),
        legend.key.size = unit(0, "cm"),
        plot.title = element_text(size = 25),
        plot.background = element_rect(fill = "#E6D4C3", color = NA),
        plot.margin = margin(0.2, .3, 0.1, .3, "cm"),
        plot.caption = element_text(size = 10),
        plot.caption.position = "plot",
        strip.text = element_text(size = 20, hjust = 0.2))