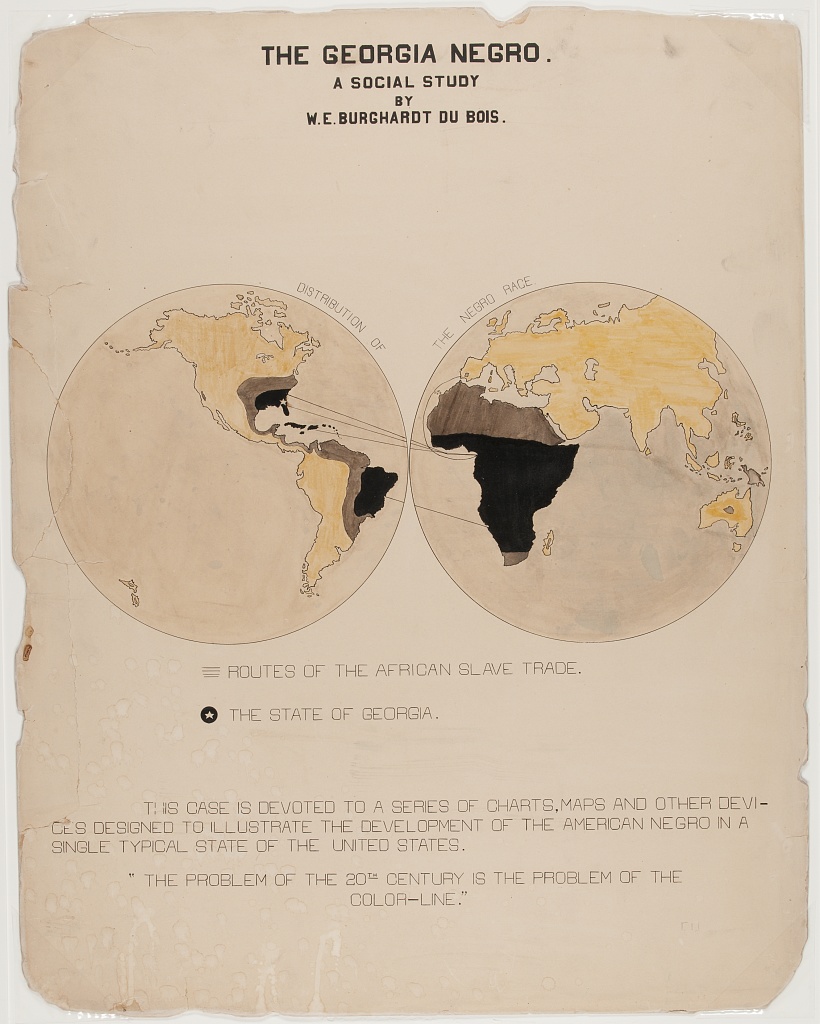
Recreating the the data visualization of W.E.B Du Bois from the 1900 Paris Exposition using modern tools. See the challenge presentation.
This week, the data provided1 don’t match the visualization. So we are free to be more creative…
We’ll try to show who profited from the slave trade by looking at the origin of the ships involved.
Setup
library(tidyverse)
library(tidygeocoder)
library(leaflet)

options(scipen = 100)

# compute mode (from https://stackoverflow.com/a/45216553)
stat_mode <- function(x, return_multiple = FALSE, na.rm = FALSE) {
  if(na.rm){
    x <- na.omit(x)
  }
  ux <- unique(x)
  freq <- tabulate(match(x, ux))
  mode_loc <- if(return_multiple) which(freq == max(freq)) else which.max(freq)
  return(ux[mode_loc])
}
Data
We impute the missing data and do some cleaning then we sum the slaves numbers by ships’ home port.
data_04 <- read_csv("routes.csv", na = "NA")

ports <- data_04 |>
  group_by(ship_name) |>
  mutate(port_origin = if_else(
           is.na(port_origin),
           stat_mode(port_origin, na.rm = TRUE),
           port_origin),
         port_geo = str_replace(port_origin,
           ", port unspecified|, colony unspecified|, location unspecified",
           ""),
         port_geo = case_match(port_geo,
           "Southeast Brazil"   ~ "Rio de Janeiro",
           "Princes Island"     ~ "Sao Tome",
           "Para"               ~ "Belém",
           "Lyme"               ~ "Lyme Regis",
           "Les Sables"         ~ "Les Sables d'Olonnes",
           "Charlestown"        ~ "Boston",
           "Cabanas"            ~ "Cabañas, Cuba",
           "Camaret"            ~ "Camaret-sur-Mer",
           "Goree"              ~ "Gorée",
           "Saint-Louis"        ~ "Saint-Louis, Saint-Louis, Sénégal",
           "Montrose"           ~ "Montrose, Scotland",
           "Salem"              ~ "Salem, Massachussets",
           "Stockton"           ~ "Newcastle",
           "Cardenas"           ~ "Cárdenas, Cuba",
           "Newbury"            ~ "Newbury, Massachussets",
           "Norfolk"            ~ "Norfolk, Virginia",
           "Portuguese Guinea"  ~ "Guinea-Bissau",
           "Ilho do Fayal"      ~ "Azores",
           "Lancaster"          ~ "Lancaster, UK",
           "British Americas"   ~ "New England",
           "Warren"             ~ "Warren, Rhode Island",
           "St. Thomas"         ~ "United States Virgin Islands",
           "Danish West Indies" ~ "United States Virgin Islands",
           "Mediterranean coast (France)"         ~ "Marseille",
           "Sao Tome or Princes Island"           ~ "Sao Tome",
           "Spanish Caribbean, unspecified"       ~ "Havana",
           "Spanish Circum-Caribbean,unspecified" ~ "Havana",
           "Catuamo and Maria Farinha"            ~ "Pernambuco",
           .default = port_geo),
         n_slaves_arrived = if_else(is.na(n_slaves_arrived),
                                    round(median(n_slaves_arrived, na.rm = TRUE)),
                                    n_slaves_arrived)) |>
  group_by(port_geo) |>
  summarise(n_slaves = sum(n_slaves_arrived, na.rm = TRUE)) |>
  filter(n_slaves > 0) |>
  drop_na(port_geo) |>
  arrange(desc(n_slaves))
Then we geocode:
ports_geo <- ports |>
  geocode(port_geo, method = "osm")
Warning
Although I did clean the data, some errors in geocoding may persist.
Map
ports_geo |>
  leaflet() |>
  addTiles() |>
  addCircleMarkers(radius = ~ sqrt(n_slaves) / 50,
                   popup = ~ paste0("<strong>", port_geo, "</strong><br />",
                                    format(n_slaves, big.mark = ","),
" slaves shipped"))Footnotes
The dataset seems to come from https://www.slavevoyages.org/voyage/database.↩︎
