library(dplyr)
library(ggplot2)
library(scales)
library(glue)
library(terra)

source("spilhaus.R") # from https://github.com/rtlemos/spilhaus/ see belowDay 26 of 30DayMapChallenge: « Map projections » (previously).
After seeing this post by Cédric Vidonne I had to try to use the Spilhaus projection too.
Config
Data
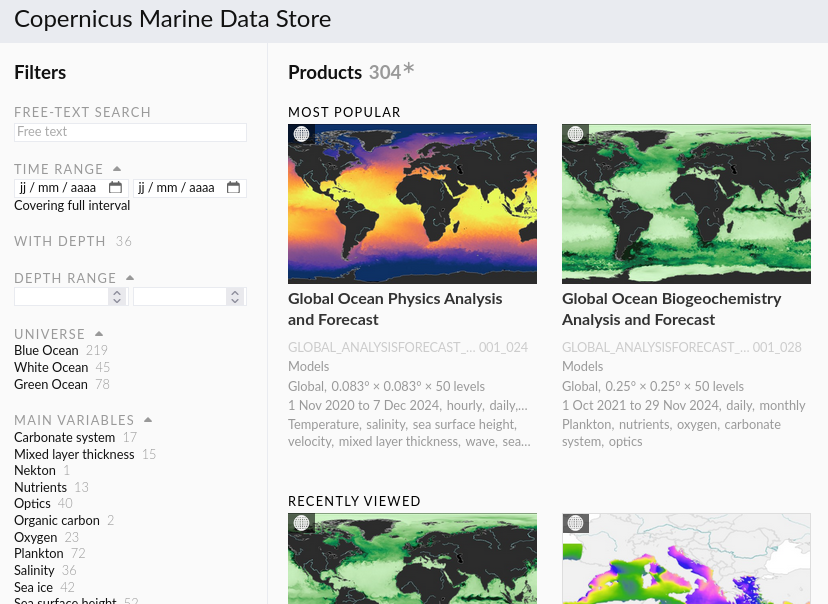
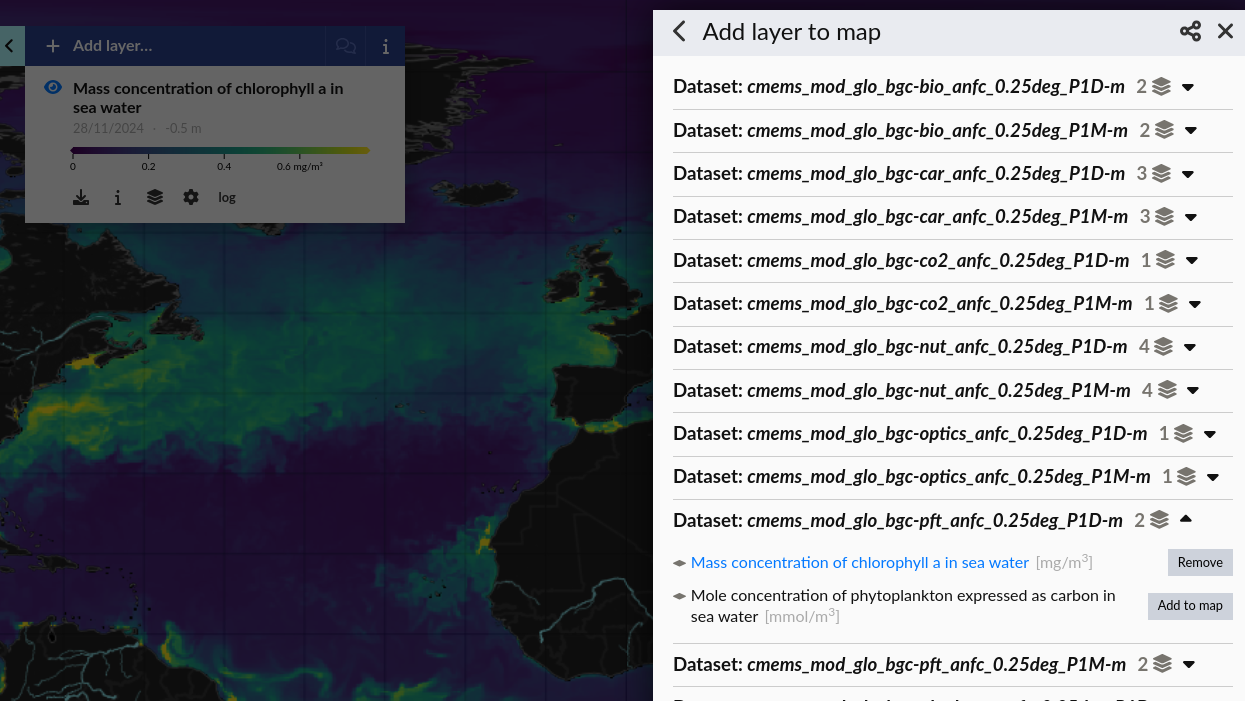
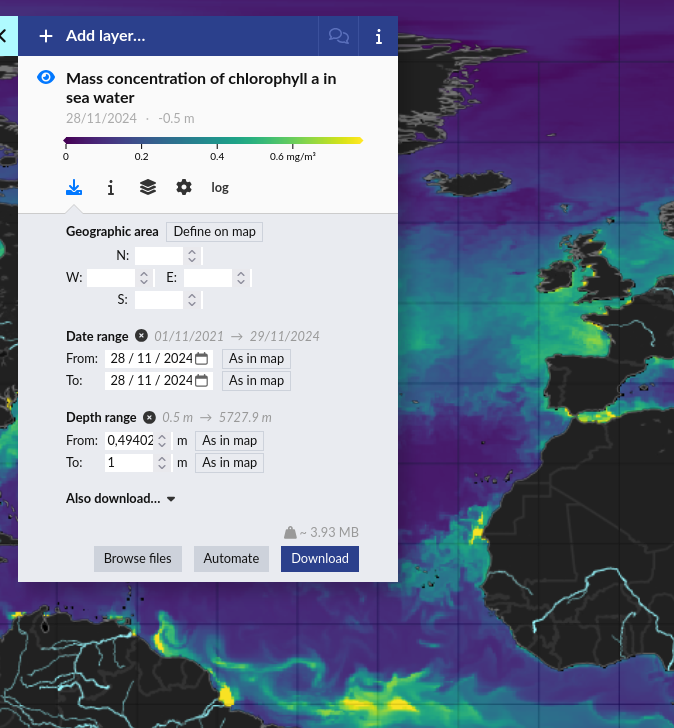
Mass concentration of chlorophyll a in sea water. Get the current data from Copernicus: Global Ocean Biogeochemistry Analysis and Forecast (European Union-Copernicus Marine Service 2019). You’ll need to register first.
An API is available, but for this one shot, a manual download is easier (Figure 1, Figure 2, Figure 3).
chlorophyll <- rast("cmems_mod_glo_bgc-pft_anfc_0.25deg_P1D-m_1732694885194.nc")Reproject
Based on the functions made by Ricardo T. Lemos.
spilhaus_df <- make_spilhaus_xy_gridpoints(spilhaus_res = 1000)
lonlat <- from_spilhaus_xy_to_lonlat(spilhaus_df$x, spilhaus_df$y)

spilhaus_df$z <- pull(extract(chlorophyll, lonlat), 1)
spilhaus_df$l <- is.na(spilhaus_df$z)

pretty_spilhaus_df <- pretify_spilhaus_df(spilhaus_df)
Map
pretty_spilhaus_df |>
  ggplot(aes(x, y, fill = z)) +
  geom_raster() +
  scale_fill_viridis_c(option = "viridis",
                       limits = c(0, .8),
                       na.value = viridis_pal()(2)[2],
                       name = bquote(atop("2024-11-28", "Chlorophyll a ("*mg %.% m^-3*")"))) +
  coord_equal() +
  labs(caption = glue("https://r.iresmi.net/ - {Sys.Date()}
                      Generated using E.U. Copernicus Marine Service Information 10.48670/moi-00015")) +
  theme_void() +
  theme(plot.background = element_rect(fill = "black",
                                        color = "black"),
        plot.caption = element_text(size = 6,
                                    color = "darkgrey"),
        legend.position = c(0.85, 0.85),
        legend.title = element_text(color = "white"),
        legend.text = element_text(color = "white"))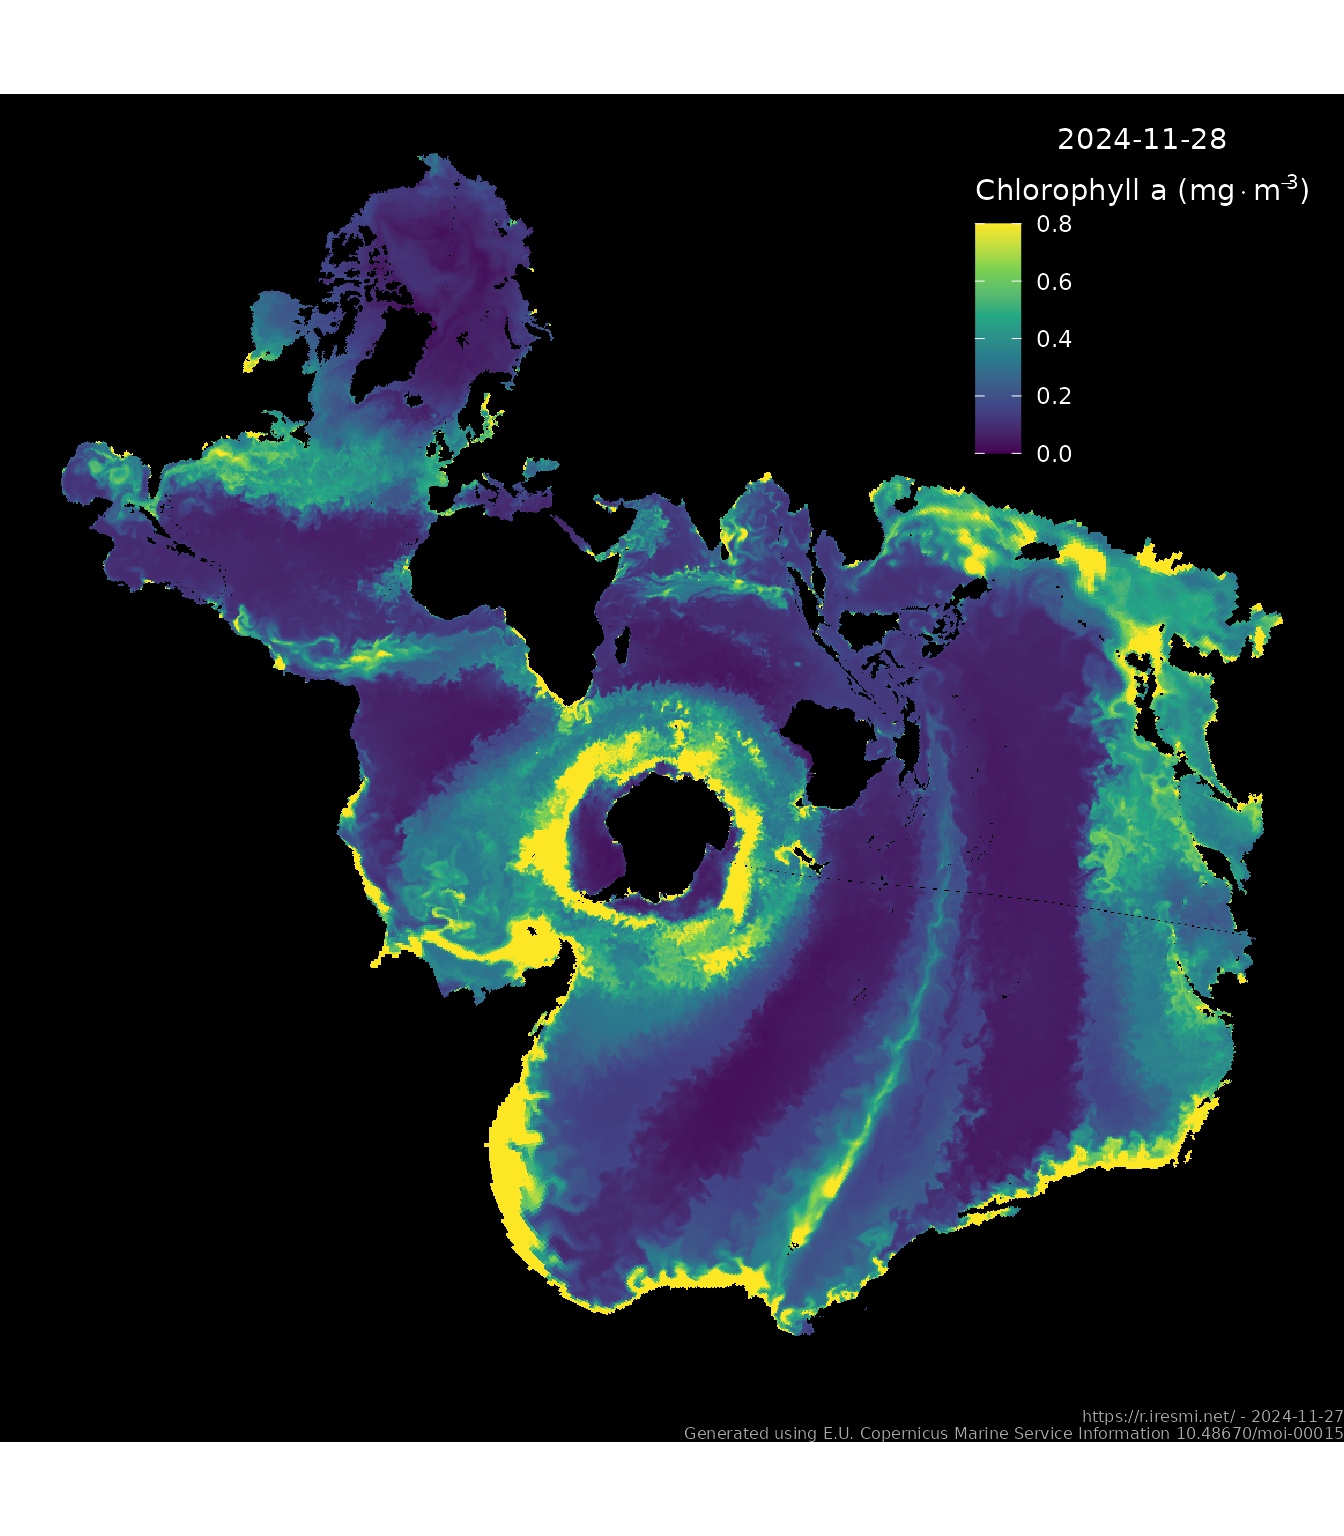
References
European Union-Copernicus Marine Service. 2019. “Global Ocean Biogeochemistry Analysis and Forecast.” Mercator Ocean International. https://doi.org/10.48670/MOI-00015.
