# parameters --------------------------------------------------------------

max_group_size <- 60 # we work on groups from 1 to max_group_size individuals
iterations <- 1e5    # for a good precision use more than 1e4
cores <- 10          # number of CPU cores to use

# config ------------------------------------------------------------------

library(dplyr)
library(ggplot2)
library(tibble)
library(furrr)
library(purrr)

plan(multisession, workers = cores)
The birthday problem is a classic counter-intuitive mathematical result concerning the probability that two people, in a group, have the same birthday. The formal solution is too complex for me but I can use simulations to find out…
Config
Utilities
Two functions to find birthday date collision in a simulated group and repeat this simulation for different group size.
#' detect a collision in a group of simulated birthdays
#'
#' bissextiles years are taken into account
#'
#' @param group_size (int) : group size
#' @returns (lgl) : is there at least 2 people with the same birthday date ?
birthday_collision <- function(group_size) {
  birthdays <- sample(1:366,
                      size = group_size,
                      prob = c(rep(1, 59), .2425, rep(1, 306)),
                      replace = TRUE)
  collisions <- group_size - length(unique(birthdays))
  return(collisions > 0)
}

#' simulate many groups and compute the collision probability
#'
#' @param group_size (int) : group size
#' @param iterations (int) : number of simulations to run
#' @returns (dbl) : collision probability
collision_prob <- function(group_size, iterations = 1e5) {
  res <- vector(length = iterations) |>
    map_lgl(\(x) birthday_collision(group_size))
  return(sum(res) / length(res))
}

#' Convert scientific number to plotmath expression
#'
#' @param x (num) : a number in scientific format like 1e5
#'
#' @returns : plotmath expresion
scientific_10 <- function(x) {
  parse(text = gsub("e\\+*", " %*% 10^", scales::scientific_format()(x))) }
Let’s run it! (in parallel)
# simulate for groups with different size
simulated_groups <- tibble(group_size = 2:max_group_size) |>
  mutate(proba = future_map_dbl(group_size,
                                \(s) collision_prob(s, iterations),
                                .options = furrr_options(seed = TRUE)))

# find the 50% limit
pcent50 <- simulated_groups |>
  filter(proba >= .5) |>
  slice_head(n = 1)
And plot it…
simulated_groups |>
  ggplot(aes(group_size, proba)) +
  geom_step(direction = "hv") +
  geom_segment(data = pcent50, aes(xend = group_size, yend = 0), linetype = 3) +
  geom_segment(data = pcent50, aes(xend = 0, yend = proba), linetype = 3) +
  annotate(geom = "text", x = pcent50[[1, "group_size"]], y = -.02,
           size = 3,
           label = pcent50[[1, "group_size"]]) +
  scale_x_continuous(breaks = scales::breaks_pretty()) +
  scale_y_continuous(breaks = scales::breaks_pretty(),
                     labels = scales::label_percent(decimal.mark = ",",
                                                    suffix = " %")) +
  labs(title = "Probability that at least two people share the same birthday",
       subtitle = "in a group",
       x = "group size",
       y = "probablity",
       caption = bquote(atop("https://r.iresmi.net/",
                             simulations~with~
                               .(parse(text = scientific_10(iterations))[[1]])~
                               iterations))) +
  theme_minimal() +
  theme(plot.caption = element_text(size = 6),
        plot.background = element_rect(fill = "white"))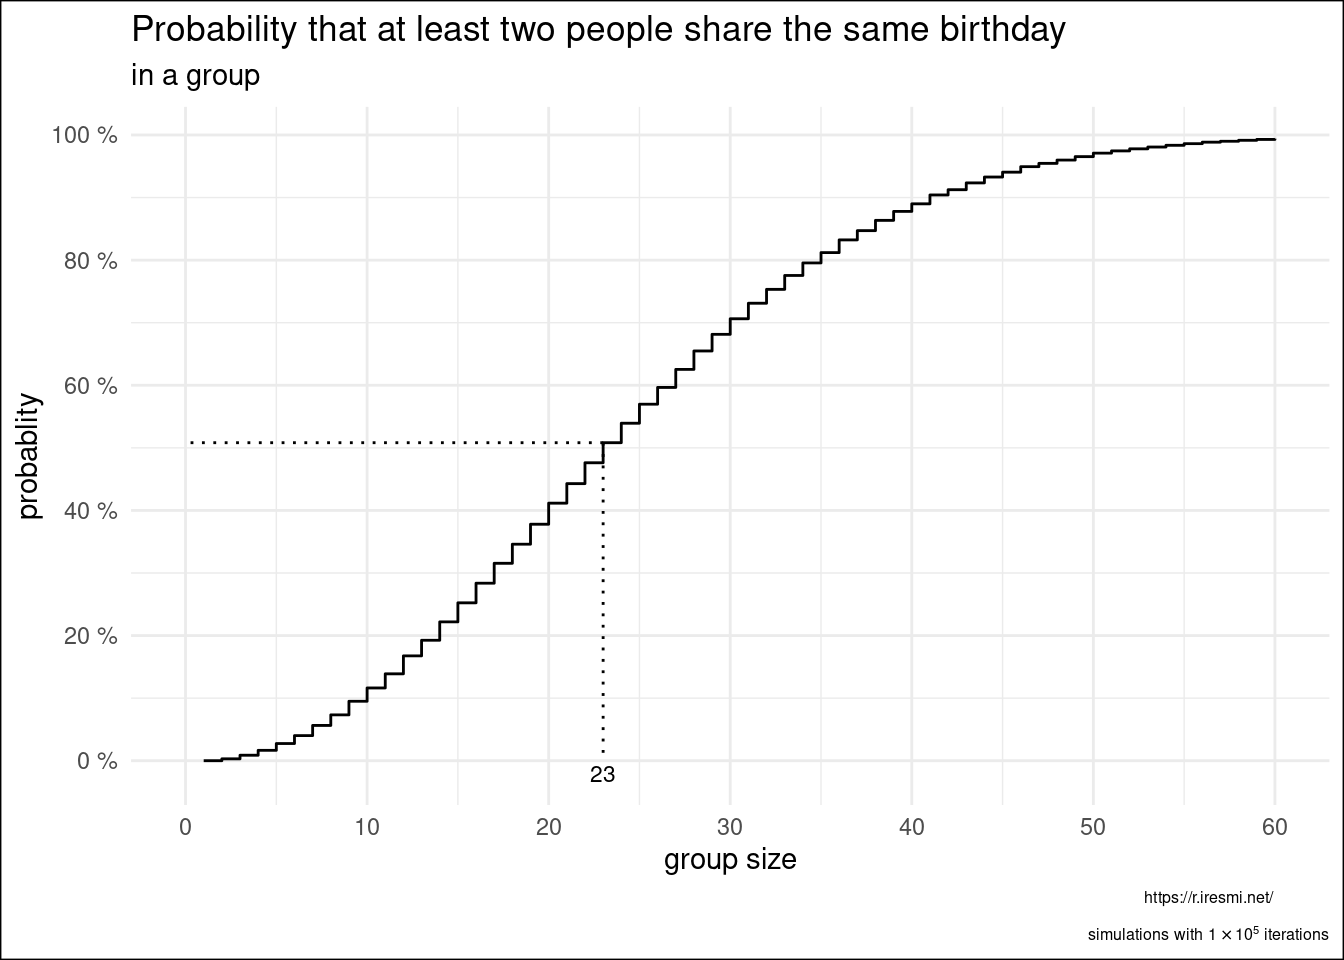
We can see that a group of 23 people is enough to get a 50% probability to have at least two people with the same birthday date.