library(sf)
library(dplyr)
library(ggplot2)
library(glue)
library(purrr)
library(polylabelr)
Day 7 of 30DayMapChallenge: « Accessibility » (previously).
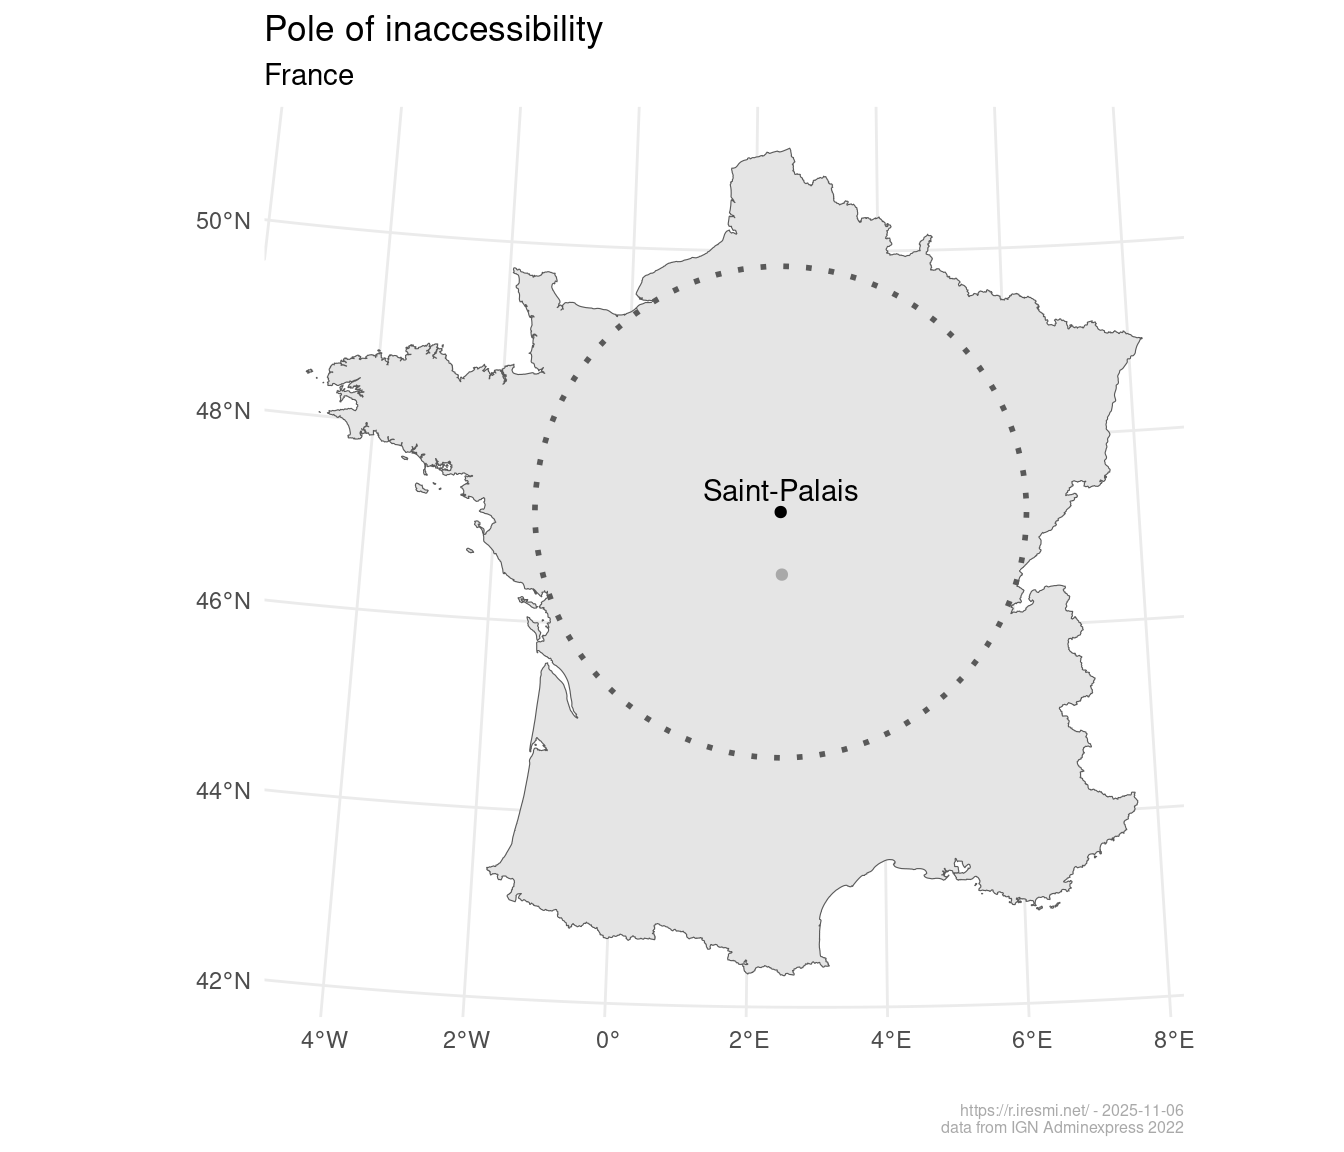
Well, let us be rebellious and instead seek inaccessibility; more precisely the pole of inaccessibility of France (the Hexagon): the farthest location from the boundary. Not to be confused with the centroid.
Data
We’ll use again the french administrative units (get the data from this post).
# France boundary
fr <- read_sf("~/data/adminexpress/adminexpress_cog_simpl_000_2022.gpkg",
              layer = "region") |>
  filter(insee_reg > "06",
         insee_reg != "94") |>
  st_transform("EPSG:2154") |>
  st_union()

# French communes to get the point name
com <- read_sf("~/data/adminexpress/adminexpress_cog_simpl_000_2022.gpkg",
               layer = "commune") |>
  filter(insee_reg > "06",
         insee_reg != "94") |>
  st_transform("EPSG:2154")
Compute the POI
Get the inaccessibility pole of France with {polylabelr} and intersects with the commune layer to find the nearest city.
fr_poi <- poi(fr) |>
  pluck(1) |>
  as_tibble() |>
  st_as_sf(coords = c("x", "y"), crs = "EPSG:2154") |>
  st_join(com)

fr_poi_circle <- fr_poi |>
  mutate(geometry = st_buffer(geometry, dist))

fr_centroid <- fr |>
  st_centroid()
It seems to be in Saint-Palais in the Cher département.
Map
fr_poi |>
  ggplot() +
  geom_sf(data = fr) +
  geom_sf(data = fr_poi_circle, linewidth = 1, linetype = 3) +
  geom_sf(data = fr_centroid, color = "darkgrey") +
  geom_sf() +
  geom_sf_text(aes(label = nom), vjust = -.5) +
  labs(title = "Pole of inaccessibility",
       subtitle = "France",
       x = "", y = "",
       caption = glue("https://r.iresmi.net/ - {Sys.Date()}
                      data from IGN Adminexpress 2022")) +
  theme_minimal() +
  theme(plot.caption = element_text(size = 6,
                                    color = "darkgrey"))