library(dplyr)
library(mapgl)
library(sf)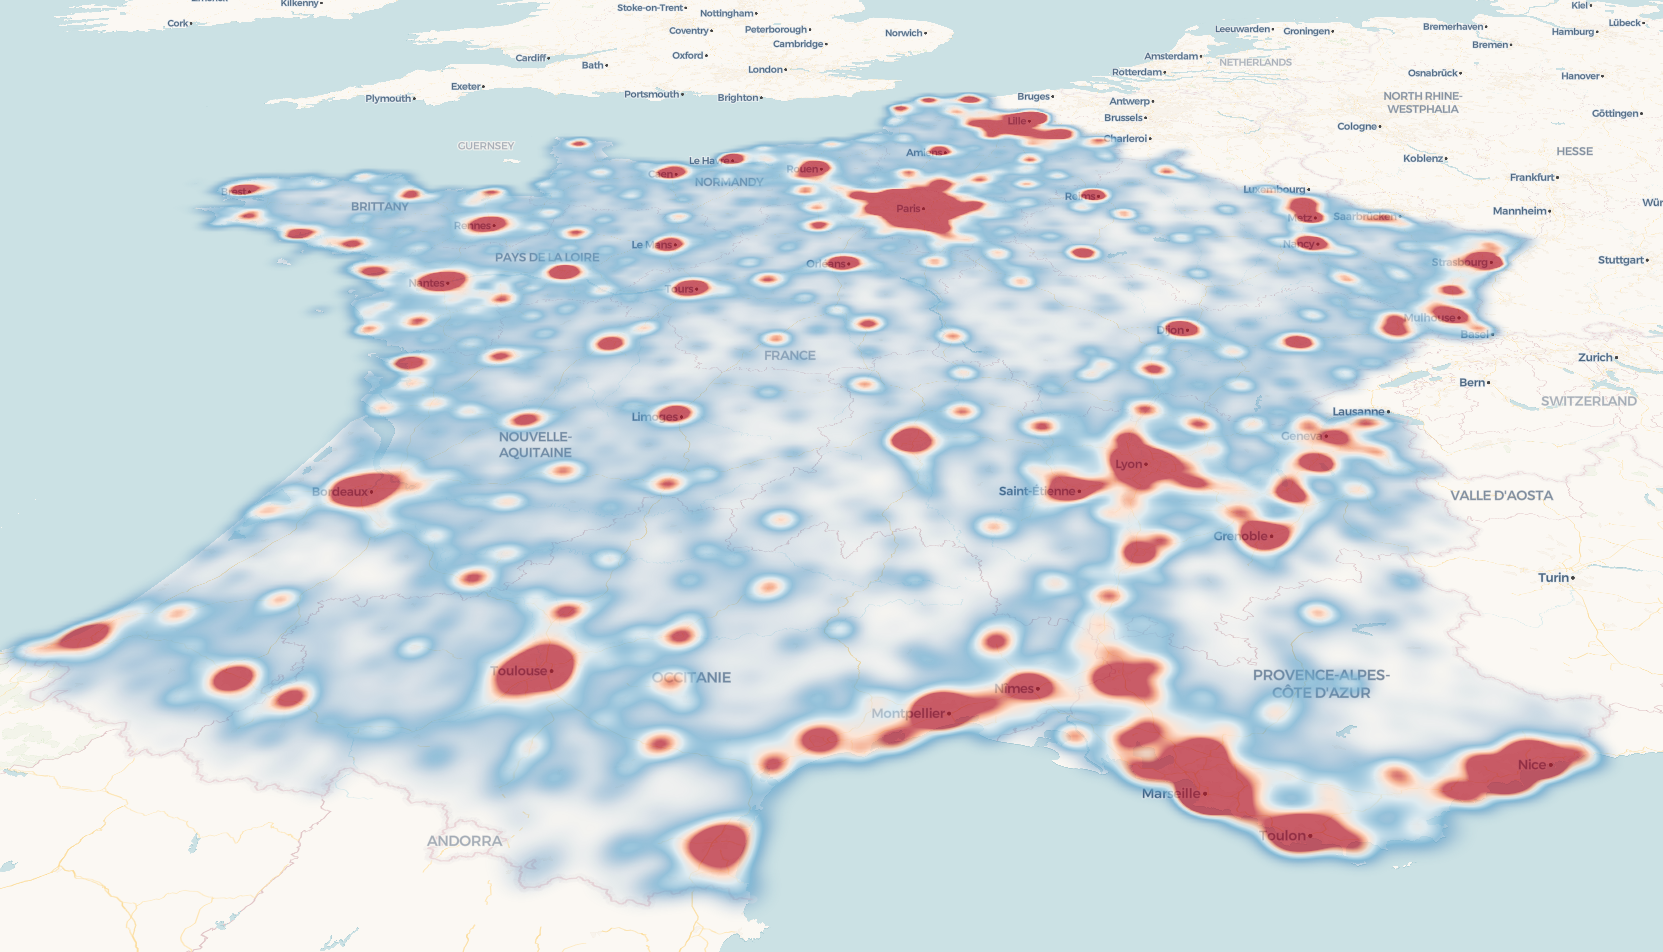
Day 17 of 30DayMapChallenge: « A new tool » (previously).
Testing Maplibre with {mapgl}.
Data
Using french communes population.
pop <- read_sf("~/data/adminexpress/adminexpress-cog-simpl-000-2024.gpkg",
               layer = "commune") |>
  st_centroid() |>
  select(population)
Map
maplibre(center = c(5, 45),
         zoom = 6) |>
  add_heatmap_layer(
    id = "pop",
    source = pop,
    heatmap_weight = interpolate(
      column = "population",
      values = c(0, max(pop$population)),
      stops = c(0, 30)),
    heatmap_intensity = interpolate(
      property = "zoom",
      values = c(0, 1),
      stops = c(9, 3)),
    heatmap_color = interpolate(
      property = "heatmap-density",
      values = seq(0, 1, 0.2),
      stops = c(
        "rgba(33,102,172,0)", "rgb(103,169,207)",
        "rgb(209,229,240)", "rgb(253,219,199)",
        "rgb(239,138,98)", "rgb(178,24,43)")),
    heatmap_opacity = 0.7
  )