library(terra)
library(dplyr)
library(ggplot2)
library(glue)
library(sf)
library(ggspatial)
library(rnaturalearth)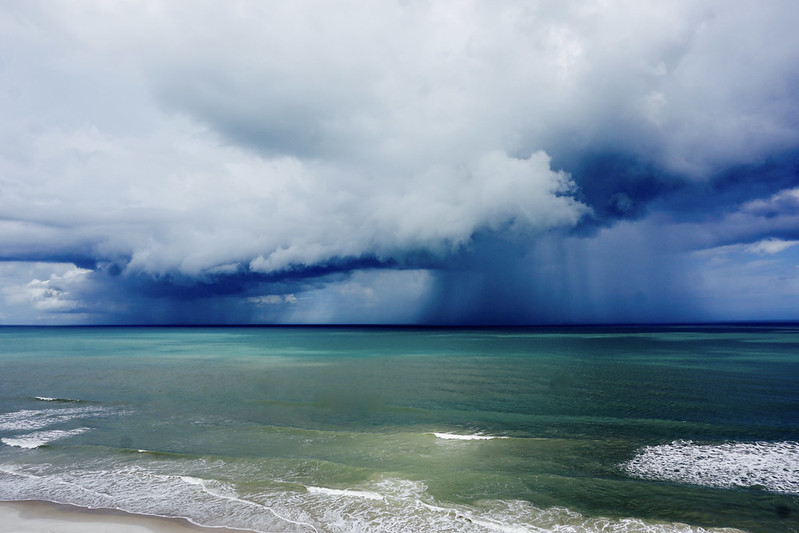
Day 10 of 30DayMapChallenge: « Air » (previously).
Where did it rain the most in a day last year?
Using ERA5 post-processed daily statistics on single levels from 1940 to present.
ERA5 is the fifth generation ECMWF reanalysis for the global climate and weather for the past 8 decades. Data is available from 1940 onwards. Reanalysis combines model data with observations from across the world into a globally complete and consistent dataset using the laws of physics.
Data
First, you need to register for a (free) account. Once the query form is sent (with year 2024, total precipitation, all months, all days etc.), your job is queued and you’ll need to wait to get your link to a downloadable dataset. It took around 35 min and we obtain a 600 MB NetCDF file.
An API is also available to automate the queries.
The coordinates are in the [0, 360] degrees range (often the case for climate data, don’t ask me why), so we need to rotate the data to find our more familiar [-180, 180]. The total precipitation is in meters; we’ll convert to cm.
# It takes a few minutes to compute, so we cache it
if (!file.exists("max_rainfall_cm.tif")) {
  rainfall <- rast("~/data/era5/4d4e91553b16edf0e896d4511e028719.nc")

  max_rainfall_cm <- max(rainfall, na.rm = TRUE) * 100
  max_rainfall_cm <- rotate(max_rainfall_cm)
  set.crs(max_rainfall_cm, "EPSG:4326")
  writeRaster(max_rainfall_cm, "max_rainfall_cm.tif",
              gdal = c("COMPRESS=DEFLATE"))
} else {
  max_rainfall_cm <- rast("max_rainfall_cm.tif")
}

# Get the world max value and its location
val_max_rainfall <- round(max(where.max(max_rainfall_cm)[[1, "value"]]), 1)
loc_max_rainfall <- xyFromCell(max_rainfall_cm,
                               where.max(max_rainfall_cm)[2]) |>
  st_point() |>
  st_sfc(crs = "EPSG:4326") |>
  st_sf() |>
  mutate(val_max_rainfall = val_max_rainfall)

# map background
world <- ne_countries()
Map
ggplot() +
  layer_spatial(data = max_rainfall_cm) +
  geom_sf(data = world, fill = NA, color = "white") +
  geom_sf(data = loc_max_rainfall, color = "red") +
  geom_sf_text(data = loc_max_rainfall, aes(label = val_max_rainfall),
               fontface = "bold", vjust = -1, color = "red") +
  scale_fill_viridis_c(name = "height (cm)", trans = "sqrt") +
  coord_sf(crs = "EPSG:8857") +
  labs(title = "Maximum daily rainfall",
       subtitle = "2024",
       fill = "type", x ="", y = "",
       caption = glue("https://r.iresmi.net/ - {Sys.Date()}
                      data: ERA5 doi:10.24381/cds.4991cf48 / Natural Earth")) +
  theme_minimal() +
  theme(plot.caption = element_text(size = 6,
                                    color = "darkgrey"),
        legend.position = "bottom")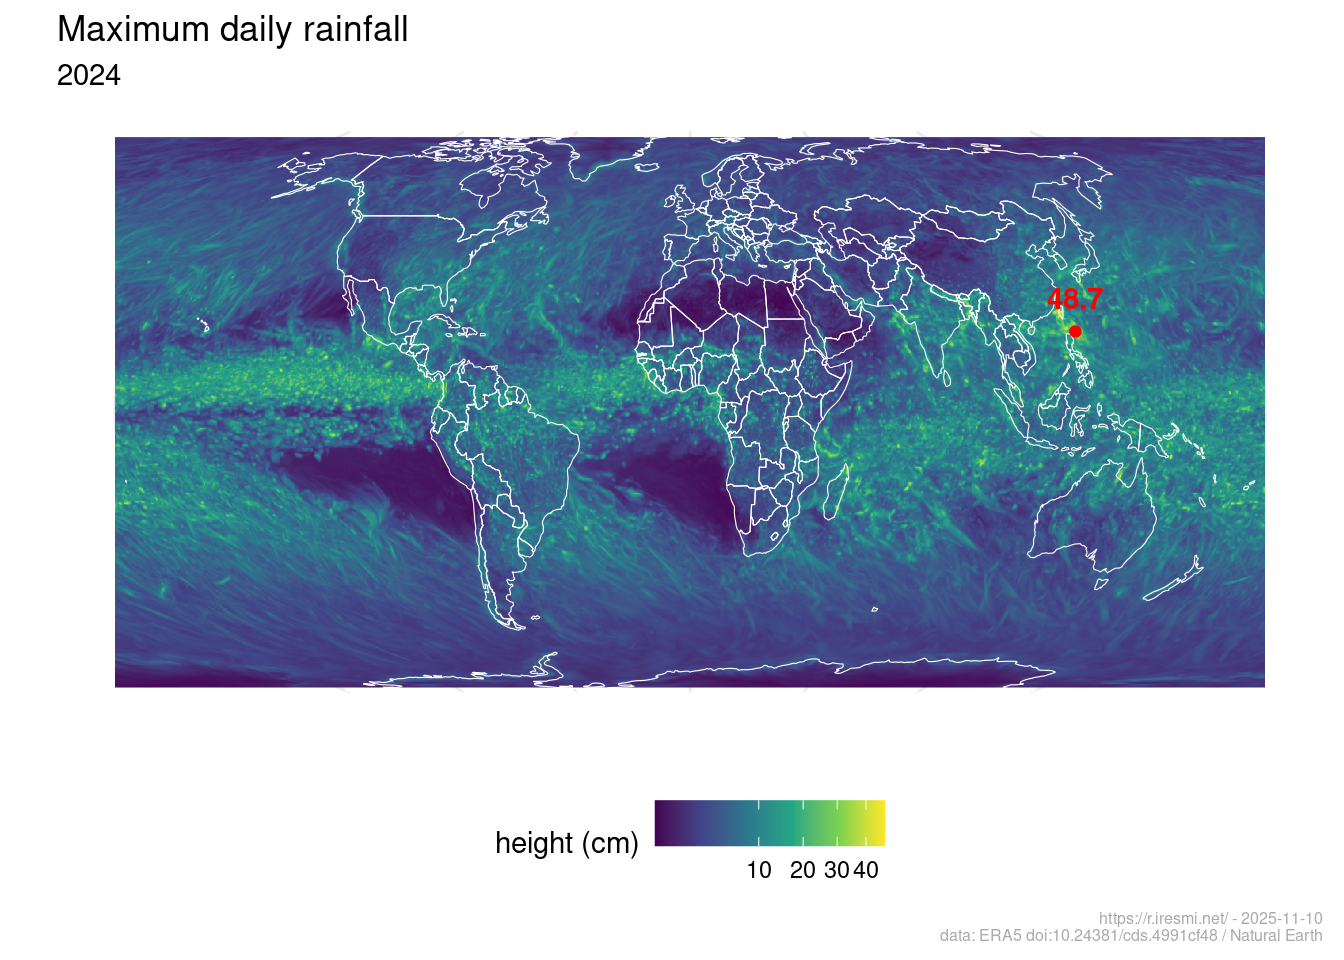
It seems the maximum rainfall in 24 hours was 48.7 cm, off the northern coast of The Philippines…
Finding the date it happened is an exercise left to the reader.