library(terra)
library(viridis)
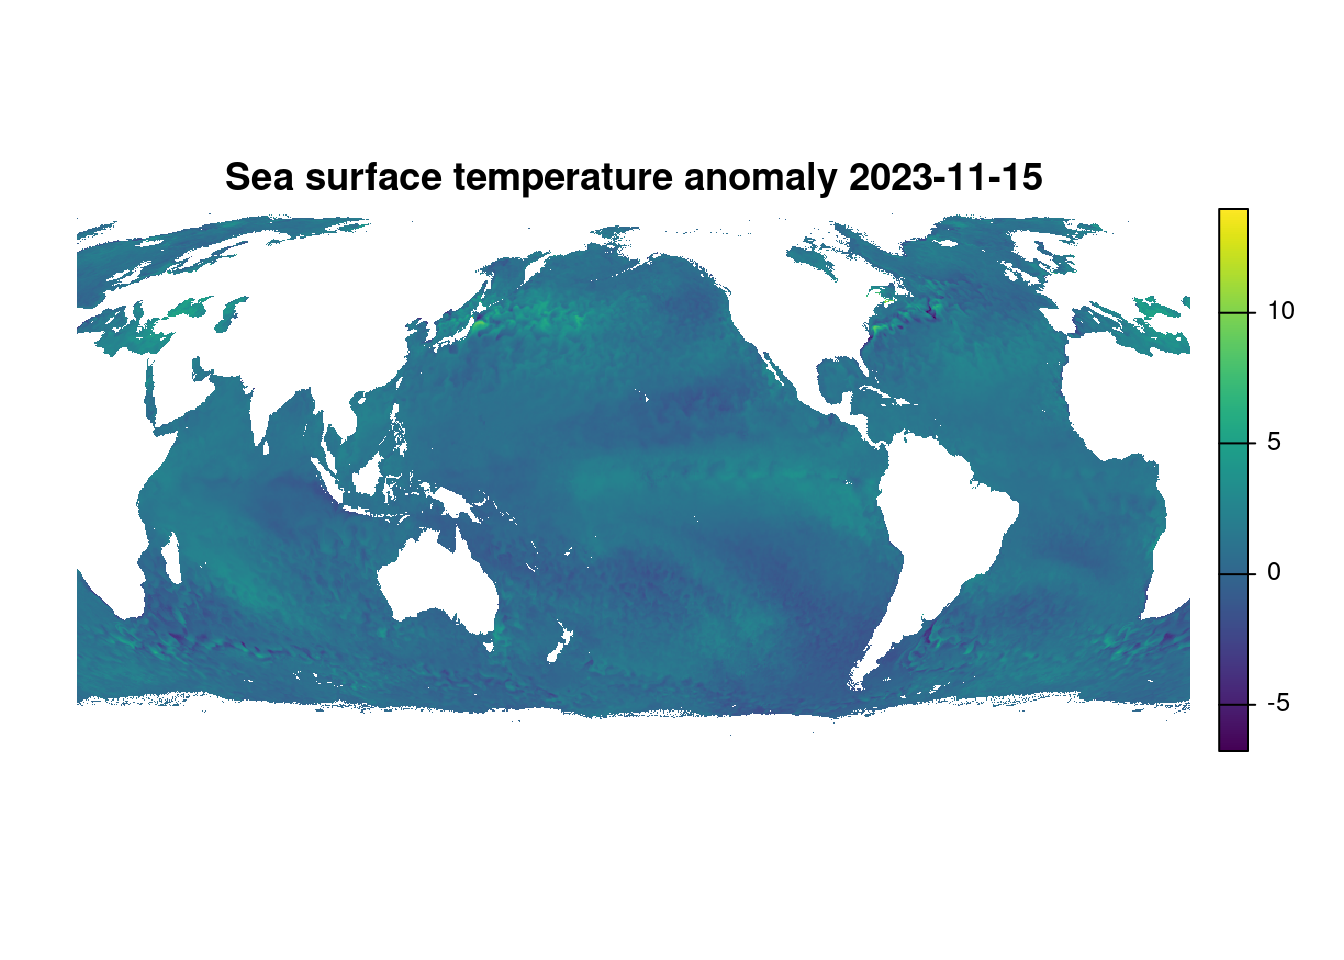
Day 16 of 30DayMapChallenge: « Oceania » (previously).
Using data from NOAA. Tried different combinations of {terra}/{stars}/{raster} and {ggplot2}/{tmap}/base::plot and between glitches, projection problems, slow plotting, limited customization, that’s not very satisfying…
ssta_file <- "ct5km_ssta_v3.1_20231115.nc"

if (!file.exists(ssta_file)) {
  download.file(paste0("https://www.star.nesdis.noaa.gov/pub/sod/mecb/crw/data/5km/v3.1_op/nc/v1.0/daily/ssta/2023/",
                       ssta_file),
                ssta_file)
}

ssta <- rast(ssta_file) |>
  project(
   'PROJCS["Sphere_Equal_Earth_Asia_Pacific",
    GEOGCS["GCS_Sphere_GRS_1980_Mean_Radius",
        DATUM["D_Sphere_GRS_1980_Mean_Radius",
            SPHEROID["Sphere_GRS_1980_Mean_Radius",6371008.7714,0.0]],
        PRIMEM["Greenwich",0.0],
        UNIT["Degree",0.0174532925199433]],
    PROJECTION["Equal_Earth"],
    PARAMETER["False_Easting",0.0],
    PARAMETER["False_Northing",0.0],
    PARAMETER["Central_Meridian",200.0],
UNIT["Meter",1.0]]')plot(ssta$sea_surface_temperature_anomaly,
col = viridis(256), axes = FALSE,
main = "Sea surface temperature anomaly 2023-11-15",)